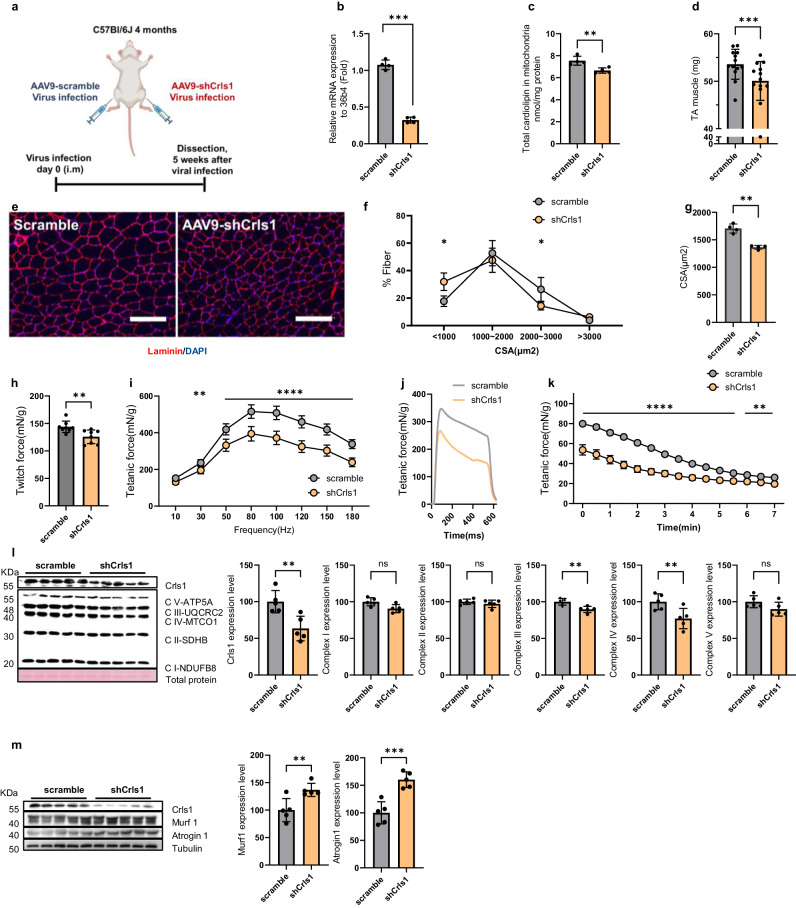
Fig. 2. AAV9-shCrls1-mediated Crls1 decreased muscle mass, force and mitochondrial complex protein levels in young TA muscle.
a Experimental schedule used to establish the AAV9-shCrls1-infected mouse model. b qPCR analysis of Crls1 gene expression in scramble- and AAV9-shCrls1 virus-infected TA muscle (n = 4 per group). c Total cardiolipin levels in the mitochondria of scramble- and AAV9-shCrls1 virus-infected TA muscle (n = 4 per group). d Viral-infected TA muscle weight (n = 13 per group). e Histological analysis of virus-infected TA muscle. Tissue sections were stained with an anti-Laminin antibody. DAPI, blue; laminin, red. Scale bar in the left panel: 125 μm (the scramble and AAV9-shCrls1 groups were infected with AAV9 (virus diluted in PBS; total of 1×10¹² GCs were injected by i.m.). Scale bar: 100 μm. f Myofiber cross-sectional area (CSA) fiber percentage in scramble- and AAV9-shCrls1 virus-infected TA muscle (n = 4 per group). g CSA fiber size mean in scramble- and AAV9-shCrls1 virus-infected TA muscle (n = 4 per group). h Measurement of the maximum twitch force at a supramaximal voltage (10 Hz) and 100 V for 1 ms (n = 8) in scramble- and AAV9-shCrls1 virus-infected TA muscle. i Frequency dependence (at 10–180 Hz, 100 V, 500 ms) of the average tetanic force in scramble- and AAV9-shCrls1 virus-infected TA muscle (n = 8 per group). j Tetanic force traces at 180 Hz for 500 ms in scramble- and AAV9-shCrls1 virus-infected TA muscle (n = 8 per group). k Fatigue indices were measured at 1 Hz and 100 V for 7 min (n = 8 per group). l Immunoblots of Crls1 and mitochondrial complex proteins in scramble- and AAV9-shCrls1 virus-infected TA muscle. The protein levels are relative to the total protein concentration (Ponceau) (n = 5 per group). Crls1 and mitochondrial complex protein expression levels relative to total protein in scramble- and AAV9-shCrls1 virus-infected TA muscle (n = 5 per group). m Immunoblotting of Crls1, Murf1, Atrogin1 and Tubulin in scramble- and AAV9-shCrls1 virus-infected TA muscle. Murf1 and Atrogin1 protein expression was normalized to tubulin (n = 5 per group). The data are presented as the mean ± standard deviation (SD) of n ≥ 3 independent experiments. P values were calculated using an unpaired Student’s t test. *P < 0.05; **P < 0.01; ***P < 0.001; n.s.: nonsignificant. C57Bl/6j young (4 to 5 mo.) mice were used.

