Figure 3.
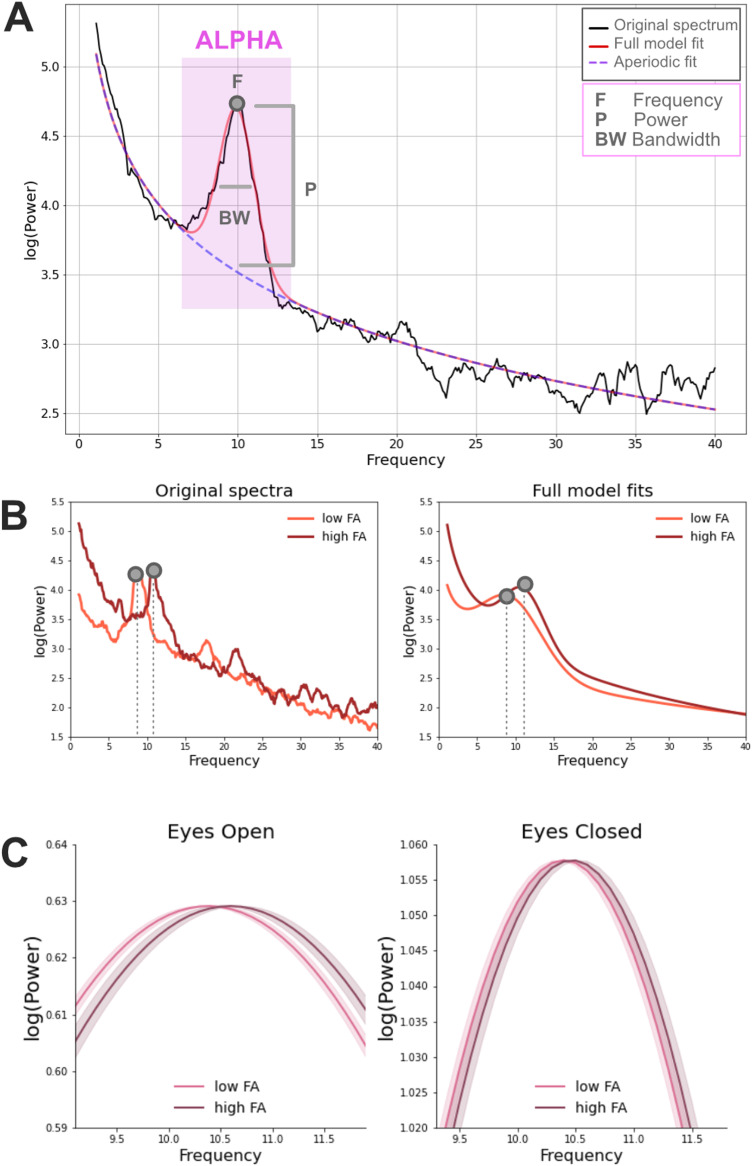
A, Example of a power spectrum from a 5-year-old male participant (in black) with closed eyes (EC). The corresponding FOOOF model fit is displayed in red and it corresponds to the sum of the periodic (Gaussian function included in the purple square) and the aperiodic signal (dashed line). Three different estimates are extracted from the periodic signal within the alpha frequency range: power, central frequency, and bandwidth. B, Examples of original power spectra and corresponding full FOOOF model fits (periodic + aperiodic components) in the EC condition. Data come from two representative male participants of 12 years of age with high and low FA average values (high FA = 0.55; low FA = 0.50; median FA = 0.53). C, Relationship between alpha frequency (after correcting for the aperiodic component) and the FA of the optic radiations in the EC and EO conditions in the full participant sample. Model fits of the periodic signal are shown for high and low FA participants (defined based on a median split). Beta estimates of alpha frequency were calculated based on the following LME model: alpha∼FA + age + (1|sj). Model fits of the periodic signal were derived based on the formula Gaussian = power*e[−(frequency − central frequency)2/(2*bandwidth2)]. The shaded areas represented ± 1 SE.

