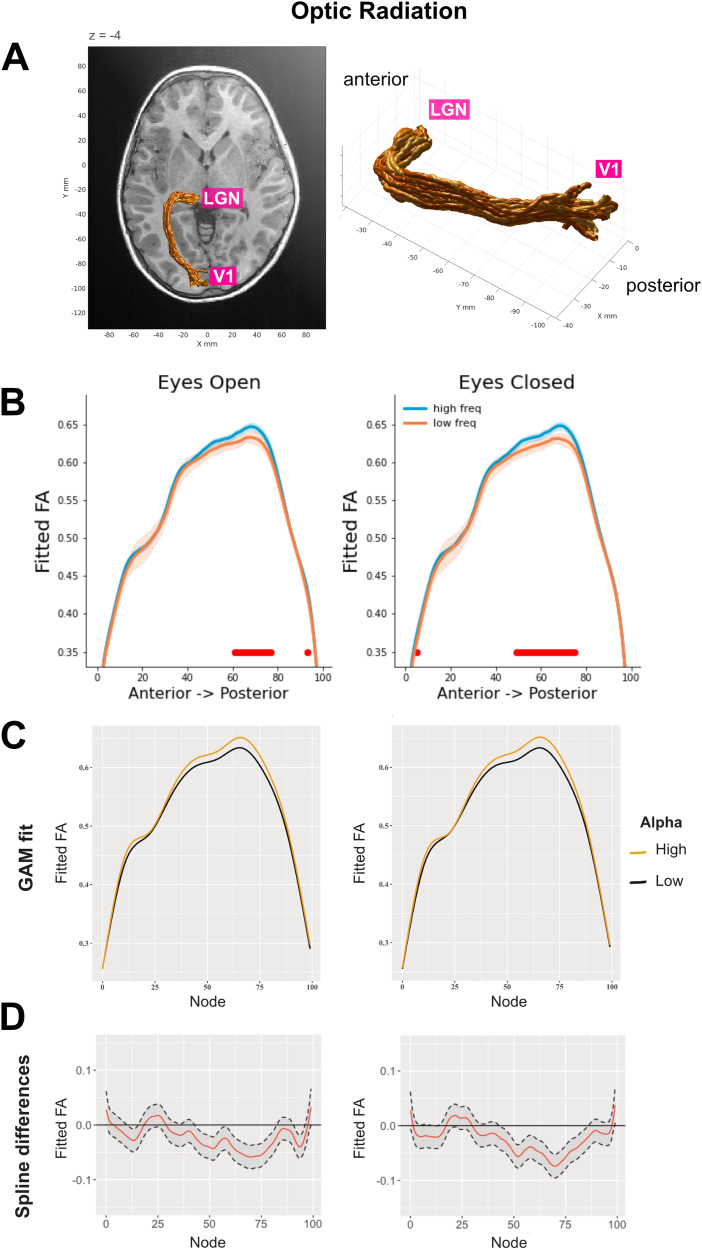
Figure 4.
A, Three-dimensional rendering of the left optic radiation for a single representative participant (5-year-old female). The rendering was derived from the Automated Fiber Quantification software (Yeatman et al., 2012). B, Tract profiles of the optic radiations FA for each alpha frequency group (defined based on a median split) in EC and EO conditions. The plots show FA values estimated based on the beta coefficients extracted from node-by-node LME models. The optic radiations FA was modeled as a function of alpha frequency after accounting for age and site location [i.e., FA∼alpha frequency + age + (1|site)]. The red horizontal lines highlight the nodes where FDR-corrected p-values are below 0.025. The shaded areas represent ± 1 SE. C,D, GAM results for tract profile analyses. We adopted a multi-analysis approach where both LME and GAM models were applied for tract profile analyses [following the guidelines from Wagenmakers et al. (2022)]. GAM models were run on the dMRI-EEG sample (n = 585) using the tractable R package (https://github.com/yeatmanlab/tractable; Richie-Halford et al., 2023, which implements the pipeline reported in Muncy et al., 2022). Our GAM formula was FA∼age + alpha frequency + s(nodeID, by = alpha frequency, k = 64) + s(subjectID, bs = “re”). C, Similar to what was seen in the results from the node-by-node LME models, GAM model fits showed that alpha frequency had an impact on the optic radiations FA, and this effect was mainly localized in the centro-posterior part of the tract (EO, estimate = 0.021, SE = 0.002, t = 12.03; EC, estimate = 0.024, SE = 0.002, t = 13.73). D, Spline differences are shown with a 95% confidence interval.

