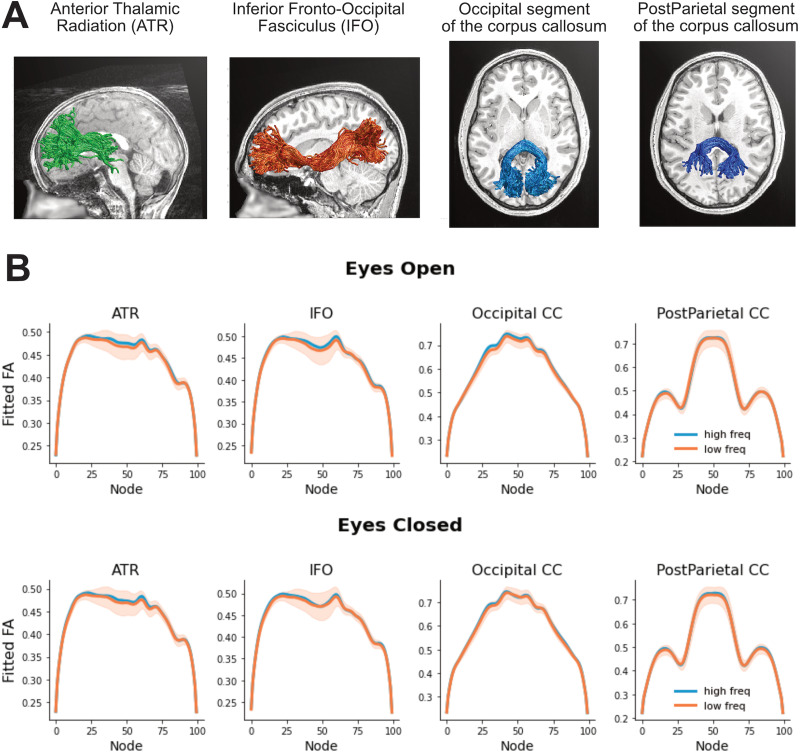
Figure 5.
A, Three-dimensional rendering of the control tracts from three representative participants (ATR, 6-year-old male; post-parietal, 7-year-old female; IFO and occipital, 12-year-old male). B, Tract profiles of control tracts for each alpha frequency group (defined based on a median split) in EC and EO conditions (first and second rows, respectively). The plots show FA values estimated based on the beta coefficients extracted from node-by-node LME models. The shaded areas represent ± 1 SE.

