
Fig. 1.
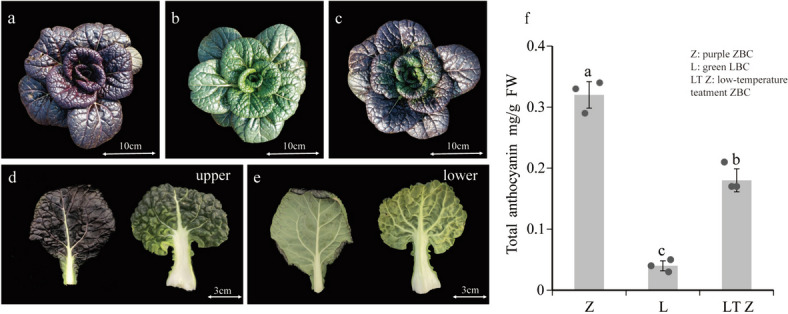
Phenotype and anthocyanin content of ZBC and LBC. a-b Phenotypes of ZBC and LBC. (c) Phenotype of ZBC after low temperature treatment. d-e Phenotypes of upper (d) and lower (e) epidermis of leaves. f Total anthocyanin content of ZBC, LBC and LTZ. Bar charts represent mean values and scatter plots represent individual data values. Z, ZBC; L, LBC; LTZ, ZBC after low temperature treatment. The data are from three independently repeated experiments. Error bars represent ± SD. Different letters indicate significant differences (p < 0.05)