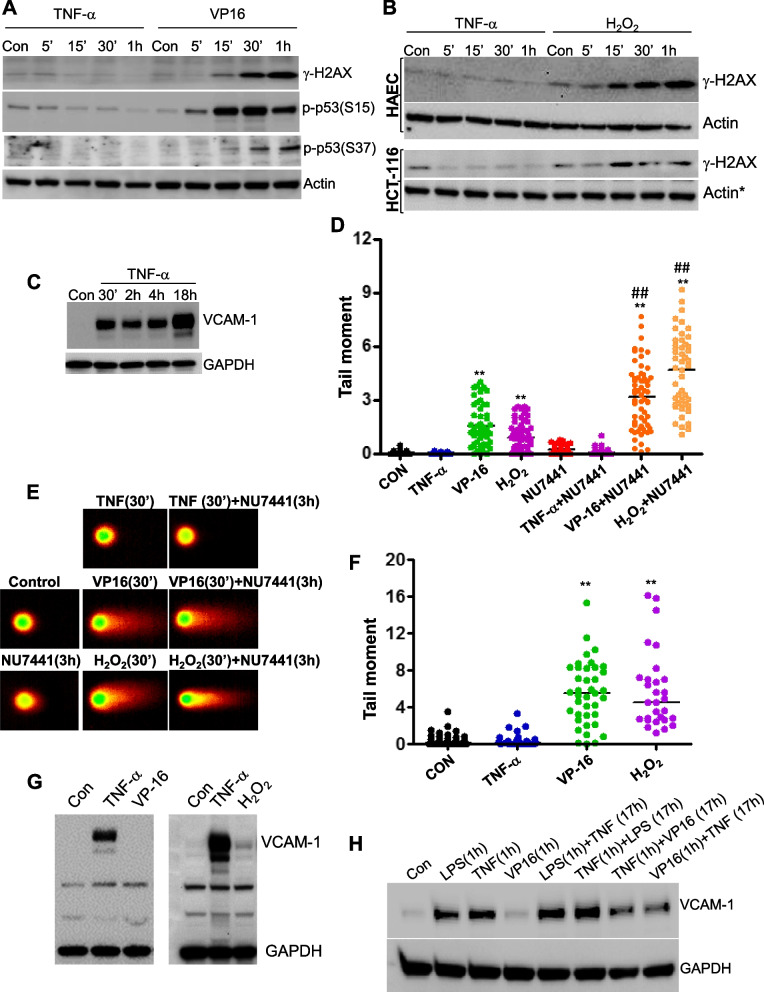
Fig. 3.
TNF-α-induced PRKDC phosphorylation is not related to DNA damage responses. A HAECs were treated with 10 ng/ml TNF-α or 20 μM VP-16 (A) or TNF-α or 100 μM H2O2 (B) as described in Fig. 2. γH2AX or phospho-p53 (S15 or S37) were determined by immunoblot analysis with antibodies specific to the modified proteins or actin. * indicates that the actin blot is the same as in Fig. 2D, bottom panels. C HAECs were treated with TNF-α for 30 min, 2 h, or 4 h, after which the medium was replaced with fresh medium without the cytokine or left unchanged. Protein extracts were prepared 18 h later for immunoblot analysis with antibodies against VCAM-1 or GAPDH. D U937 cells were treated with TNF-α, VP-16 or H2O2 for 30 min without recovery. Other sets of cells were treated with the same agents but left to recover in the presence of NU7441. All cells were then analyzed by the comet assay for the generation of DSBs. The results are presented as the tail moments of comets analyzed by the LAI Automated Comet Assay Analysis System. E Examples of comets generated by the different experimental groups described in (D). F HAECs were treated with TNF-α, VP-16 or H2O2 for 30 min without recovery, and tail moments were assessed as described in (D). G Cells were treated with TNF-α, VP-16, or H2O2 for 12 h. Extracts were subjected to immunoblot analysis for VCAM-1 or GAPDH. H HAECs were treated with TNF-α, VP-16, or LPS, individually or in combination, as indicated for the indicated times and order. All cells were collected 18 after the initial treatment, and protein extracts were subjected to immunoblot analysis with antibodies against VCAM-1 or GAPDH. **, ##, p ≤ 0.01, differences from untreated and treated groups, respectively

