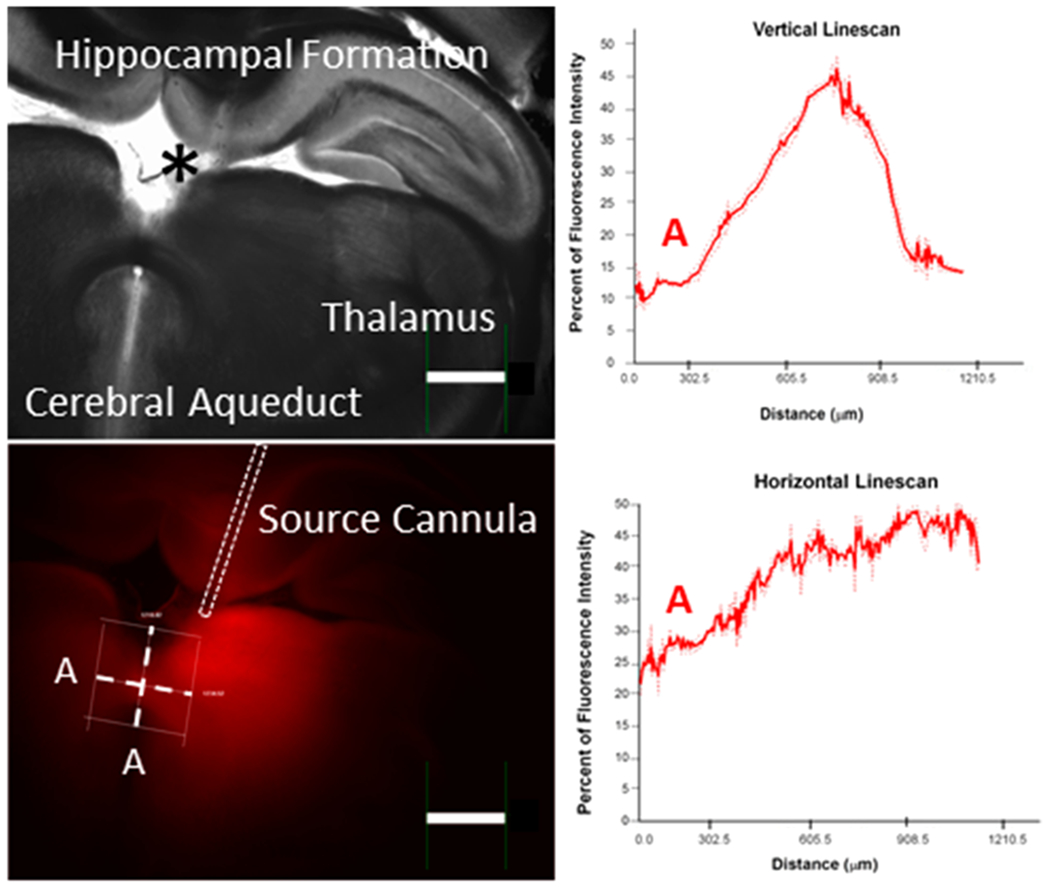
Figure 3.

Example in vivo ejection of Ru(bpy)32+ from a 100 μm inner diameter fused silica infusion cannula into the rat thalamus (AP, 4 mm from bregma) with 25 μA applied current for 45 min with the counter cannula in the contralateral hemisphere as in Figure 1. Images are brightfield (top left) and fluorescence (bottom left). The asterisk in the brightfield image denotes the third ventricle. The right panels represent the fluorescence intensity along the skewed vertical (top) and skewed horizontal (bottom) white line scans. The “A” corresponds to the distance of 0 on the plots also denoted as “A”. Dotted lines in the plots are the standard error. The scale bar is 1 000 μm.
