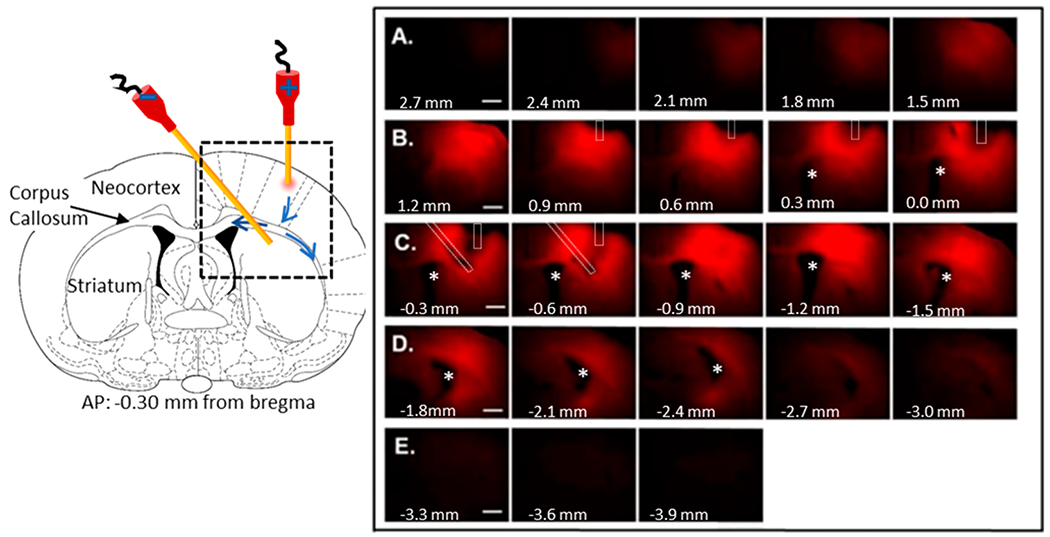
Figure 4.

Typical example of directionality in vivo of Ru(bpy)32+, from the prefrontal cortex to the striatum with 75 μA applied for 5 h from a 100 μA inner diameter fused silica infusion cannula. (Left) Schematic of the experimental design with the cannula placement in a coronal section at AP = bregma − 0.3 mm. The source has the positive electrode. Black dashed box represents the area of the fluorescence images in the right panel. Major brain regions are identified in the left half of the coronal section. The blue arrows within the black dashed box show the potential path to- and along the corpus callosum. Right: Fluorescence images of the 300 μm-thick slices. Asterisks represents the lateral ventricle. Bregma coordinates for each 300-μm slice are indicated at the bottom left of each image. Letters A–E identify sequential rows of slices. Cannulas are outlined in white dashed marks. The track of the infusion capillary can be seen in bregma coordinates 0.9 mm to −0.6 mm. The plane of the counter cannula is best seen at −0.3 and −0.6 mm from bregma. Scale bar is 1,000 μm. Fluorescence images superimposed onto bright field images are shown in Figure S2, and surface intensity plots are in Figure S3.
