Figure 5.

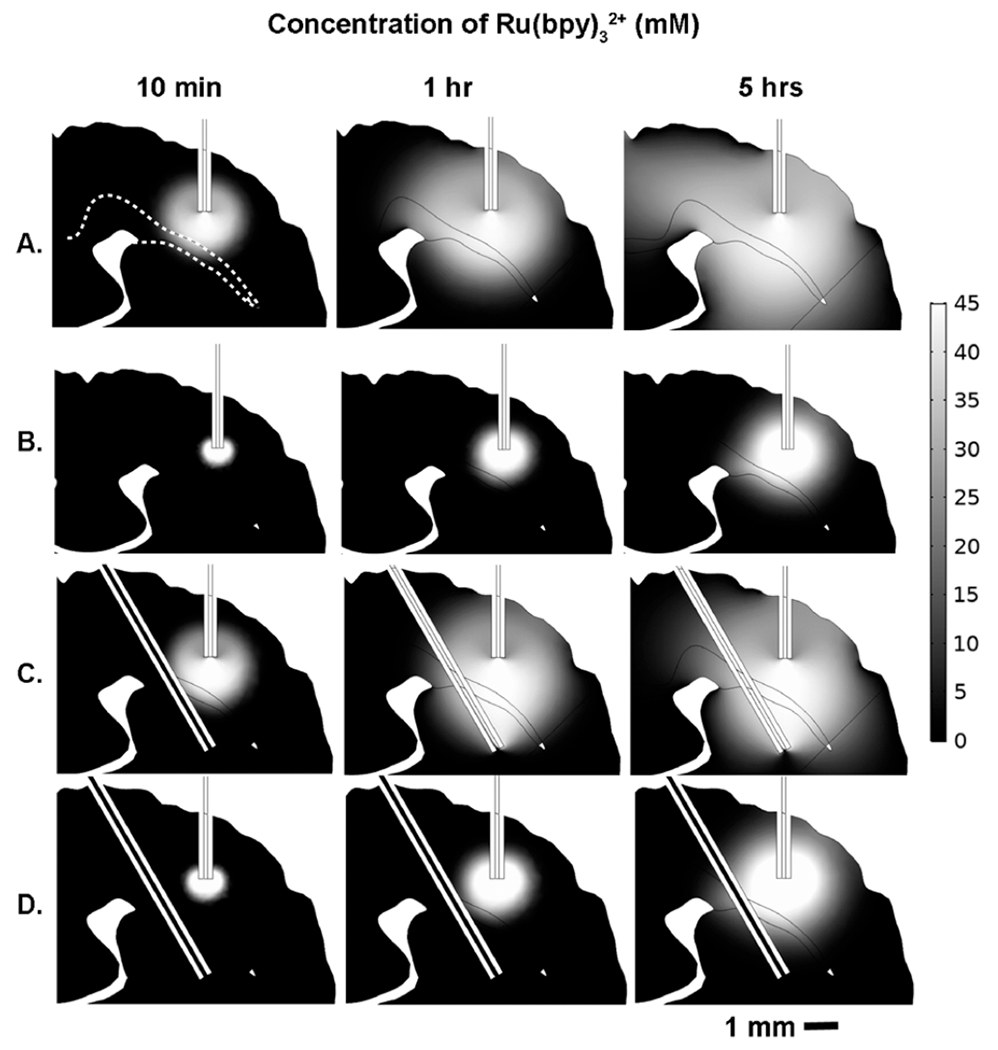
2D representative slice of the 3D geometry COMSOL calculation showing the evolution of Ru(bpy)32+ transport over time for ECED (A, C) vs pressure-driven CED (B, D). Parts A and B are single-cannula models, while parts C and D are two-cannula models. The infusion cannula is located in the cortex while the counter cannula is positioned beneath the corpus callosum in the striatum. As indicated by the scale bar, white indicates the maximum concentration, 45 mM, while black indicates zero concentration in the ECS. The corpus callosum is outlined by a white dashed line in the top left figure in part A. Snapshots of concentration profiles at three different time points are displayed for each model: 10 min, 1 h, and 5 h. Pressure boundary conditions for CED and applied potential for ECED were chosen such that the fluid flow rates in the infusion cannulas were equal in all models, ~55 nL/min.
