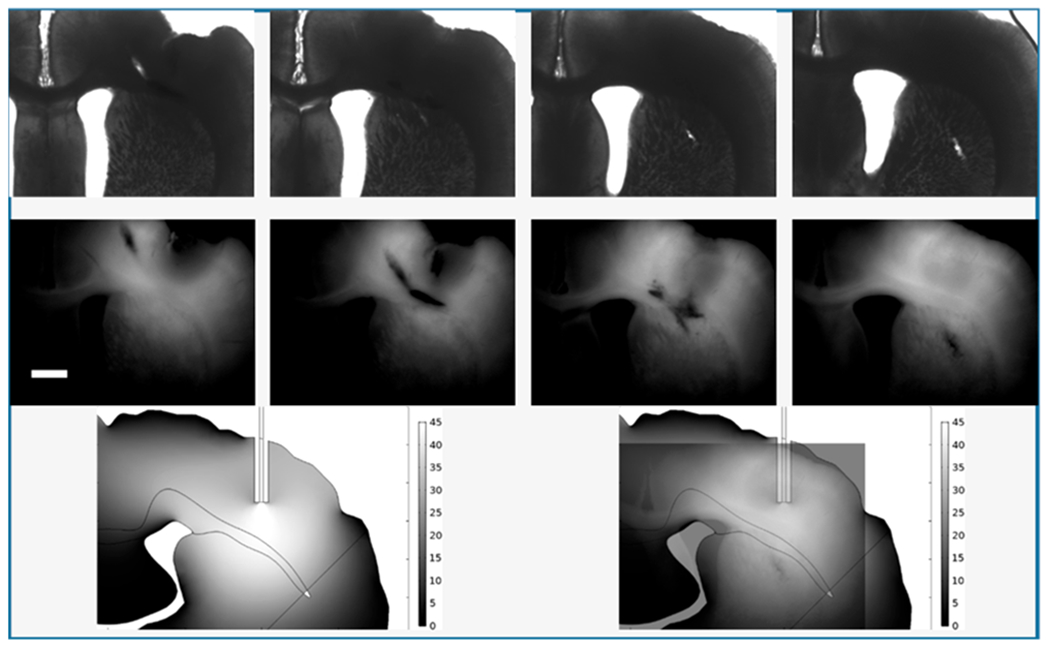
Figure 6.

Comparison of experiment and theory. Top row: slices 10–13 from Figure 3. Bottom left: Calculation from Figure 4. Bottom right: Overlay of the fluorescence image from slice 13 with 50% transparency and of the calculation to show the portion of the image of the calculation that overlaps the images of the tissue. Note that the contrast of the experimental images has been increased for visibility. Unaltered images are shown as Figure S6.
