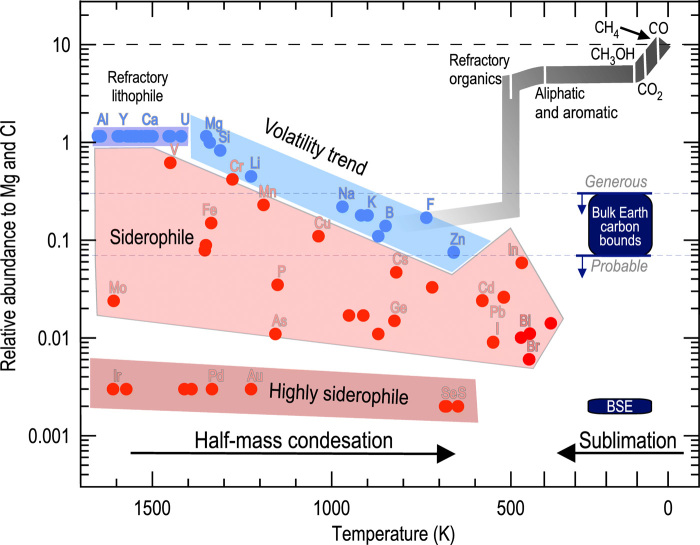
Fig. 1. The sublimation sequence of carbon in the solar nebula.
An element’s relative abundance to Mg and CI is the ratio of its relative abundance to Mg to that in CI, calculated as (C/Mg in Earth or solar)/(C/Mg in CI) in wt %. On the high-temperature side, the volatility trend (blue-shaded band) describes the relative abundances of lithophile elements (rock loving, blue circles) in the bulk silicate Earth (mantle and crust) as a function of their half-mass condensation temperatures (1). Siderophile elements (iron loving, red circles) plot below the volatility trend, presumably due to preferential incorporation into the core. On the low-temperature side, the sublimation sequence of carbon (gray thick line) traces the falling relative abundance of condensed carbon in the solar nebula (excluding H and He) as the disk warms up (tables S4 and S5). The abundance (relative to Mg and CI) of condensed carbon starts at 9.48 (long dashed line) and is reduced to 4.74 after carbon-carrying ices transform into gases. It falls precipitously by more than one order of magnitude when the nebular temperature reaches ~500 K. The maximum amount of carbon in the bulk Earth (large dark blue box), represented by a generous upper bound of 1.7 ± 0.2 wt % carbon (0.30 ± 0.03 relative to Mg and CI) and a probable bound of 0.4 ± 0.2 wt % carbon (0.07 ± 0.04 relative to Mg and CI), corresponds to a maximum fraction of 1 to 7% carbon-rich source material that survived sublimation (table S6). The bulk silicate Earth (BSE; small dark blue box) with 140 ± 40 ppm (parts per million) carbon by weight (1.7 ± 0.5 × 10⁻³ relative to Mg and CI) plots well below the upper bounds, possibly due to sequestration of carbon by the core.

