
Figure 6.
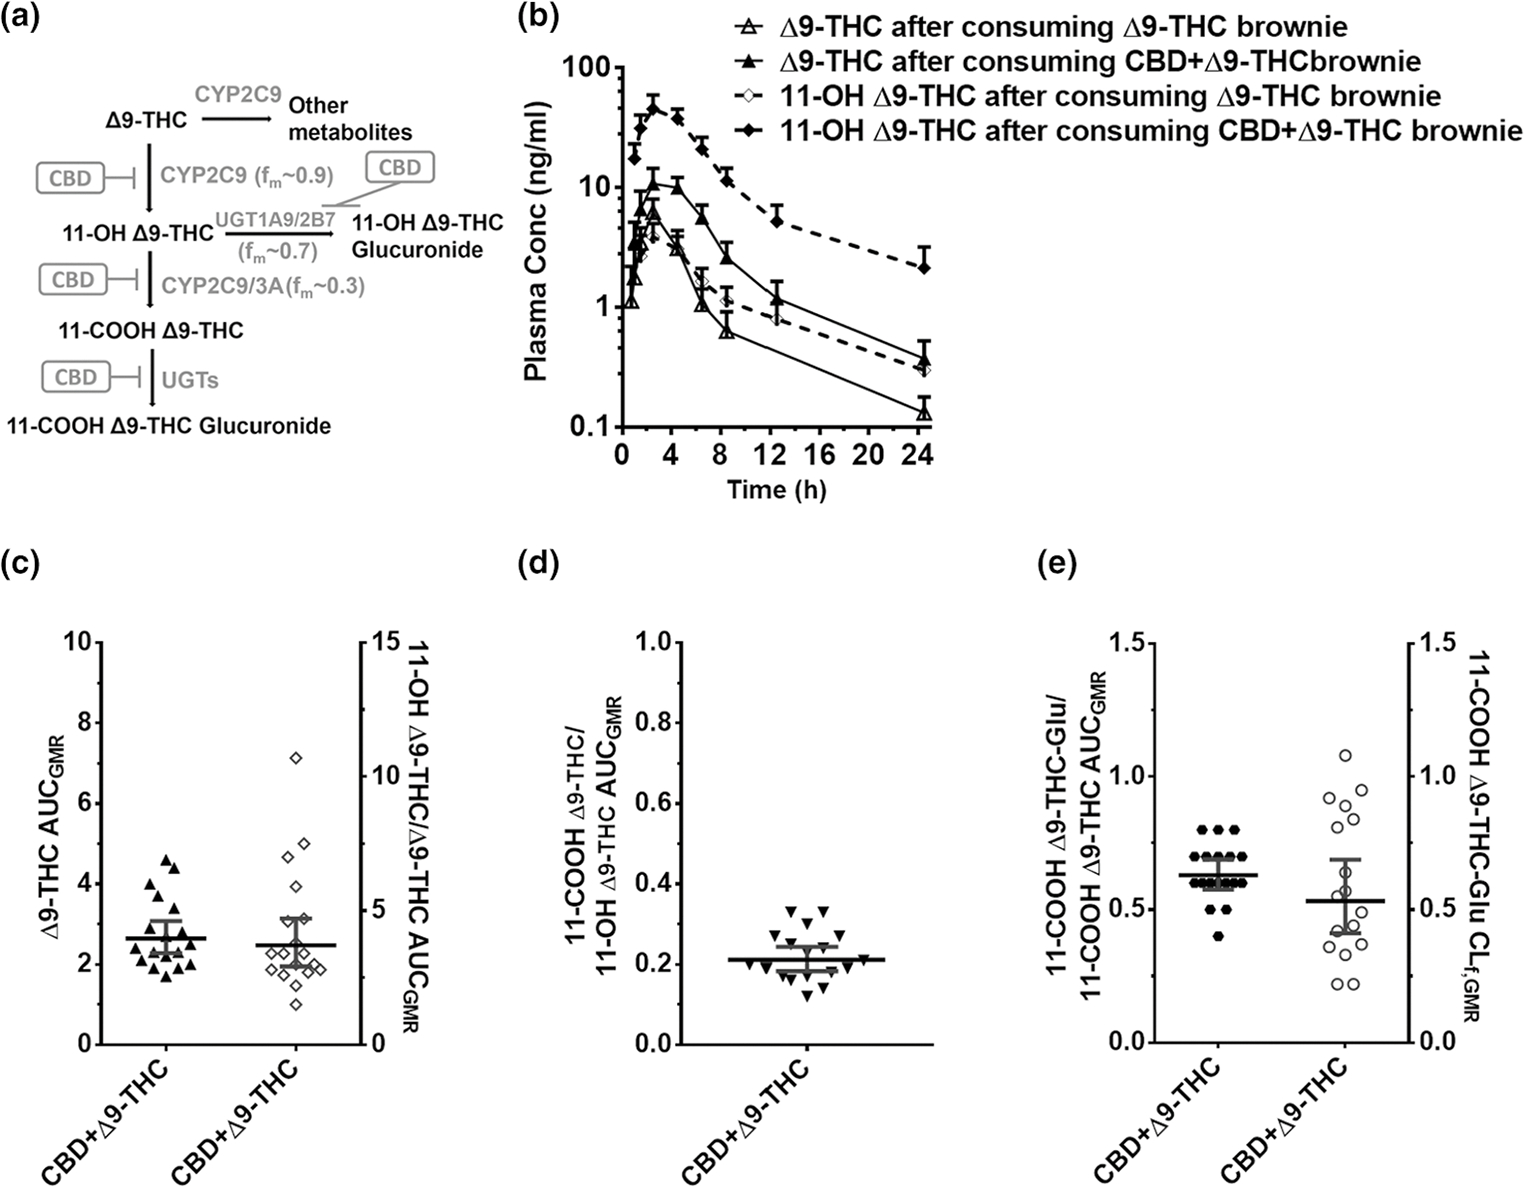
CBD-Δ9-THC PK interactions. (a) Δ9-THC biotransformation pathways inhibited by CBD. (b) Δ9-THC (continuous line) or 11-OH Δ9-THC (dashed line), plasma PK profile after administration of a brownie containing Δ9-THC (20 mg) or CBD + Δ9-THC (640 mg + 20 mg). Symbols and error bars denote geometric means and 90% CIs (shown in only one direction for visual purposes), respectively (n = 18 participants). For depiction, nominal timepoints were used. (c, d, e) Effect of the CBD + Δ9-THC brownie on Δ9-THC and Δ9-THC metabolite PK end points. Horizontal bars and vertical bars denote geometric mean ratios and 90% CIs, respectively, of the parent, metabolite/parent, or metabolite CLf in the presence of the CBD + Δ9-THC brownie vs. the Δ9-THC brownie. Symbols denote values for each participant, filled symbols refer to the left Y-axis, whereas the open symbols refer to the right Y-axis. Δ9-THC, Δ9-tetrahydrocannabinol; AUCGMR, area under the plasma concentration-time curve geometric mean ratio; CBD, cannabidiol; CI, confidence interval; CLf,GMR, formation clearance geometric mean ratio; fm, fraction metabolized by the indicated enzyme; PK, pharmacokinetic.