Abstract
Antiretroviral therapy (ART) is highly effective in suppressing human immunodeficiency virus (HIV)1; however, eradication of the virus in infected individuals has not been possible thus far2. Given that HIV suppression requires life-long ART, predominantly on a daily basis, there is a need to develop clinically effective alternatives that utilize long-acting antiviral agents to inhibit viral replication3. Here, we report the results of a two-component clinical trial involving passive transfer of two HIV-specific broadly neutralizing monoclonal antibodies (bNAbs) 3BNC117 and 10–1074. The first component was a randomized, double-blind, placebo-controlled trial that enrolled participants who initiated ART during the acute/early phase of HIV infection. The second component was an open-label single arm trial that enrolled ART-naive viremic controllers. Up to 8 infusions of 3BNC117 and 10–1074, administered over a period of 24 weeks, were well-tolerated without any serious adverse events related to the infusions. Compared with placebo, the combination bNAbs maintained complete suppression of plasma viremia (up to 43 weeks) following analytical treatment interruption (ATI), provided that no antibody-resistant HIV was detected at baseline in the study participants. Similarly, potent HIV suppression was seen in the ART-naïve, viremic study participants carrying sensitive virus at baseline. Our data demonstrate that combination bNAb therapy can provide long-term ART-free virologic suppression in infected individuals and our experience offers guidance for future clinical trials involving next generation antibodies with long half-lives.
Modern ART allows near complete suppression of plasma viremia in most HIV-infected individuals1. However, difficulties in adherence to a lifetime of medication, long-term side effects, and the possibility for developing antiretroviral drug-resistant virus have prompted intense research aimed at developing new therapies to achieve sustained virologic remission without the need for daily ART4. In this regard, considerable efforts have focused on eliminating the persistent HIV reservoir5,6, one of the major impediments to viral eradication7–9, in HIV-infected individuals receiving clinically effective ART10. However, despite decades of research, it is becoming increasingly clear that complete eradication of the persistent HIV reservoir in an infected individual is not feasible using currently available approaches and therapies11. In the absence of an effective vaccine against HIV and/or therapeutic agents that can eradicate the persistent viral reservoir, long-term suppression of plasma viremia by infrequent administration of long-acting antiretroviral drugs12–14 or bNAbs15–18 against HIV remains the most realistic approach for achieving ART-free virologic suppression. In this regard, passive transfer of single bNAbs in HIV-infected individuals in the context of ATI has shown limited success in part due to the presence of pre-existing and/or emergent antibody-resistant virus19–22. To mitigate this shortcoming, a combination approach involving the use of two bNAbs that bind to different regions of the HIV Env glycoprotein has led to promising results15,23. One such study utilized two bNAbs, one targeting the CD4 binding site on the HIV Env spike (3BNC117) and the other targeting the V3 loop and surrounding glycans (10–1074), demonstrated that three infusions over a period of 6 weeks significantly delayed plasma viral rebound in infected individuals following ATI23. In addition, previous studies have suggested that, besides their ability to neutralize HIV, certain bNAbs could potentially mediate clearance of persistent viral reservoirs and/or enhance host immunity against the virus24–27. Accordingly, we conducted the present study to further investigate the long-term impact of the combination of bNAbs 3BNC117 and 10–1074 on suppression of plasma viremia, the dynamics of persistent viral reservoirs, and their effect on immune parameters/responses in HIV-infected individuals.
Study design and participants
Between September 2018 and January 2021, we conducted a phase 1 clinical trial to assess the safety, tolerability, and efficacy of the combination of bNAbs 3BNC117 and 10–1074 in HIV-infected individuals. This trial consisted of two components: 1) a randomized, double-blind, placebo-controlled study involving 14 participants in whom ART was initiated during the acute/early phase of infection and who subsequently underwent ATI shortly after receiving the first infusion of bNAbs or placebo (Group 1) and 2) an open-label study involving 5 viremic controllers who were ART-naïve and had baseline plasma viremia between 200–5,000 copies/ml (Group 2) (Table 1, Extended Data Fig. 1, and Supplementary Table 1). Study participants were not pre-screened for sensitivity of their HIV to 3BNC117 and 10–1074 prior to enrollment (see Methods for study inclusion criteria). The randomized controlled portion of the study had a planned enrollment of 30 study participants. However, the study was prematurely halted in March 2020 due to the increased safety concerns associated with ATI in the setting of the COVID-19 pandemic.
Table 1:
Baseline characteristics of study participants
| Group 1 | Group 2 | |||
|---|---|---|---|---|
| Characteristic | Antibody Arm (n = 7) |
Placebo Arm (n = 7) |
n = 5 | |
| Sex, number (%) | ||||
| Male | 7 (100) | 7 (100) | 5 (100) | |
| Age, years | ||||
| Median (range) | 40 (27–57) | 34 (29–56) | 44 (35–52) | |
| Race or ethnic group, number (%) | ||||
| African American | 1 (14.3) | 0 | 1 (20) | |
| Caucasian | 4 (57.1) | 5 (71.4) | 3 (60) | |
| Hispanic | 1 (14.3) | 1 (14.3) | 0 | |
| Asian | 1 (14.3) | 1 (14.3) | 0 | |
| Mixed | 0 | 0 | 1 (20) | |
| Antiretroviral regimen, number (%) | ||||
| NRTI | 7 (100) | 7 (100) | - | |
| NNRTI | 1 (14.3) | 0 | - | |
| PI/INSTI | 1 (14.3) | 0 | - | |
| INSTI | 6 (85.7) | 7 (100) | - | |
| PK | 2 (28.6) | 2 (28.6) | - | |
| Inclusion criteria met*, number (%) | ||||
| Acute infection | 5 (71.4) | 2 (28.6) | - | |
| Early infection | 2 (28.6) | 5 (71.4) | - | |
| Reported seroconversion illness, number (%) | 5 (71.4) | 4 (57.1) | - | |
| Time between HIV diagnosis and start of ART, days | ||||
| Median (range) | 22 (0–50) | 38 (9–76) | - | |
| Duration of suppressive ART at study entry**, years | ||||
| Median (range) | 3.7 (2.6–12.6) | 2.9 (1.6–6.6) | - | |
| CD4+ T cell count, cells/mm3 at study entry | ||||
| Median (range) | 799 (543–1177) | 612 (426–832) | 640 (527–1011) | |
See Methods for acute and early infection inclusion criteria.
Indicates duration of uninterrupted suppression of plasma viremia.
NRTI, nucleoside reverse transcriptase inhibitor; NNRTI, non-nucleoside reverse transcriptase inhibitor; PI, protease inhibitor; INSTI, integrase strand transfer inhibitor; PK, pharmacokinetic enhancer.
Study participants in the antibody arm of Group 1 and Group 2 received 4–8 (median 8) 3BNC117 (30mg/kg) and 10–1074 (30mg/kg) infusions, two in the first month and once monthly thereafter (Fig. 1a). The infusions of bNAbs were well-tolerated, with most adverse events (AEs) being mild-to-moderate (grade 1 or 2) transient symptoms, including chills and/or fever (Supplementary Table 2). One study participant in Group 1 (Participant 01) experienced grade 1 fever and grade 2 rigors during the first 3BNC117 infusion and did not receive the first dose of 10–1074. Thus, this participant was effectively on antibody monotherapy for the first 2 weeks of the study. For subsequent infusions, Participant 01 was premedicated with ibuprofen and completed remaining study infusions of both antibodies with minimal (grade 1) or no reactions. No participant discontinued study medications because of antibody-related AEs. There was no grade 3 or higher AE, including serious AEs (SAEs) that were judged possibly, probably, or definitely related to the study drugs. The baseline median CD4+ T cell counts for the antibody and the placebo arm of Group 1 were 799 and 612 cells/μl, respectively (Table 1). The baseline median CD4+ T cell count of Group 2 was 640 cells/μl (Table 1).
Fig. 1: Study design and effect of combination of 3BNC117 and 10–1074 on plasma viremia in study participants.
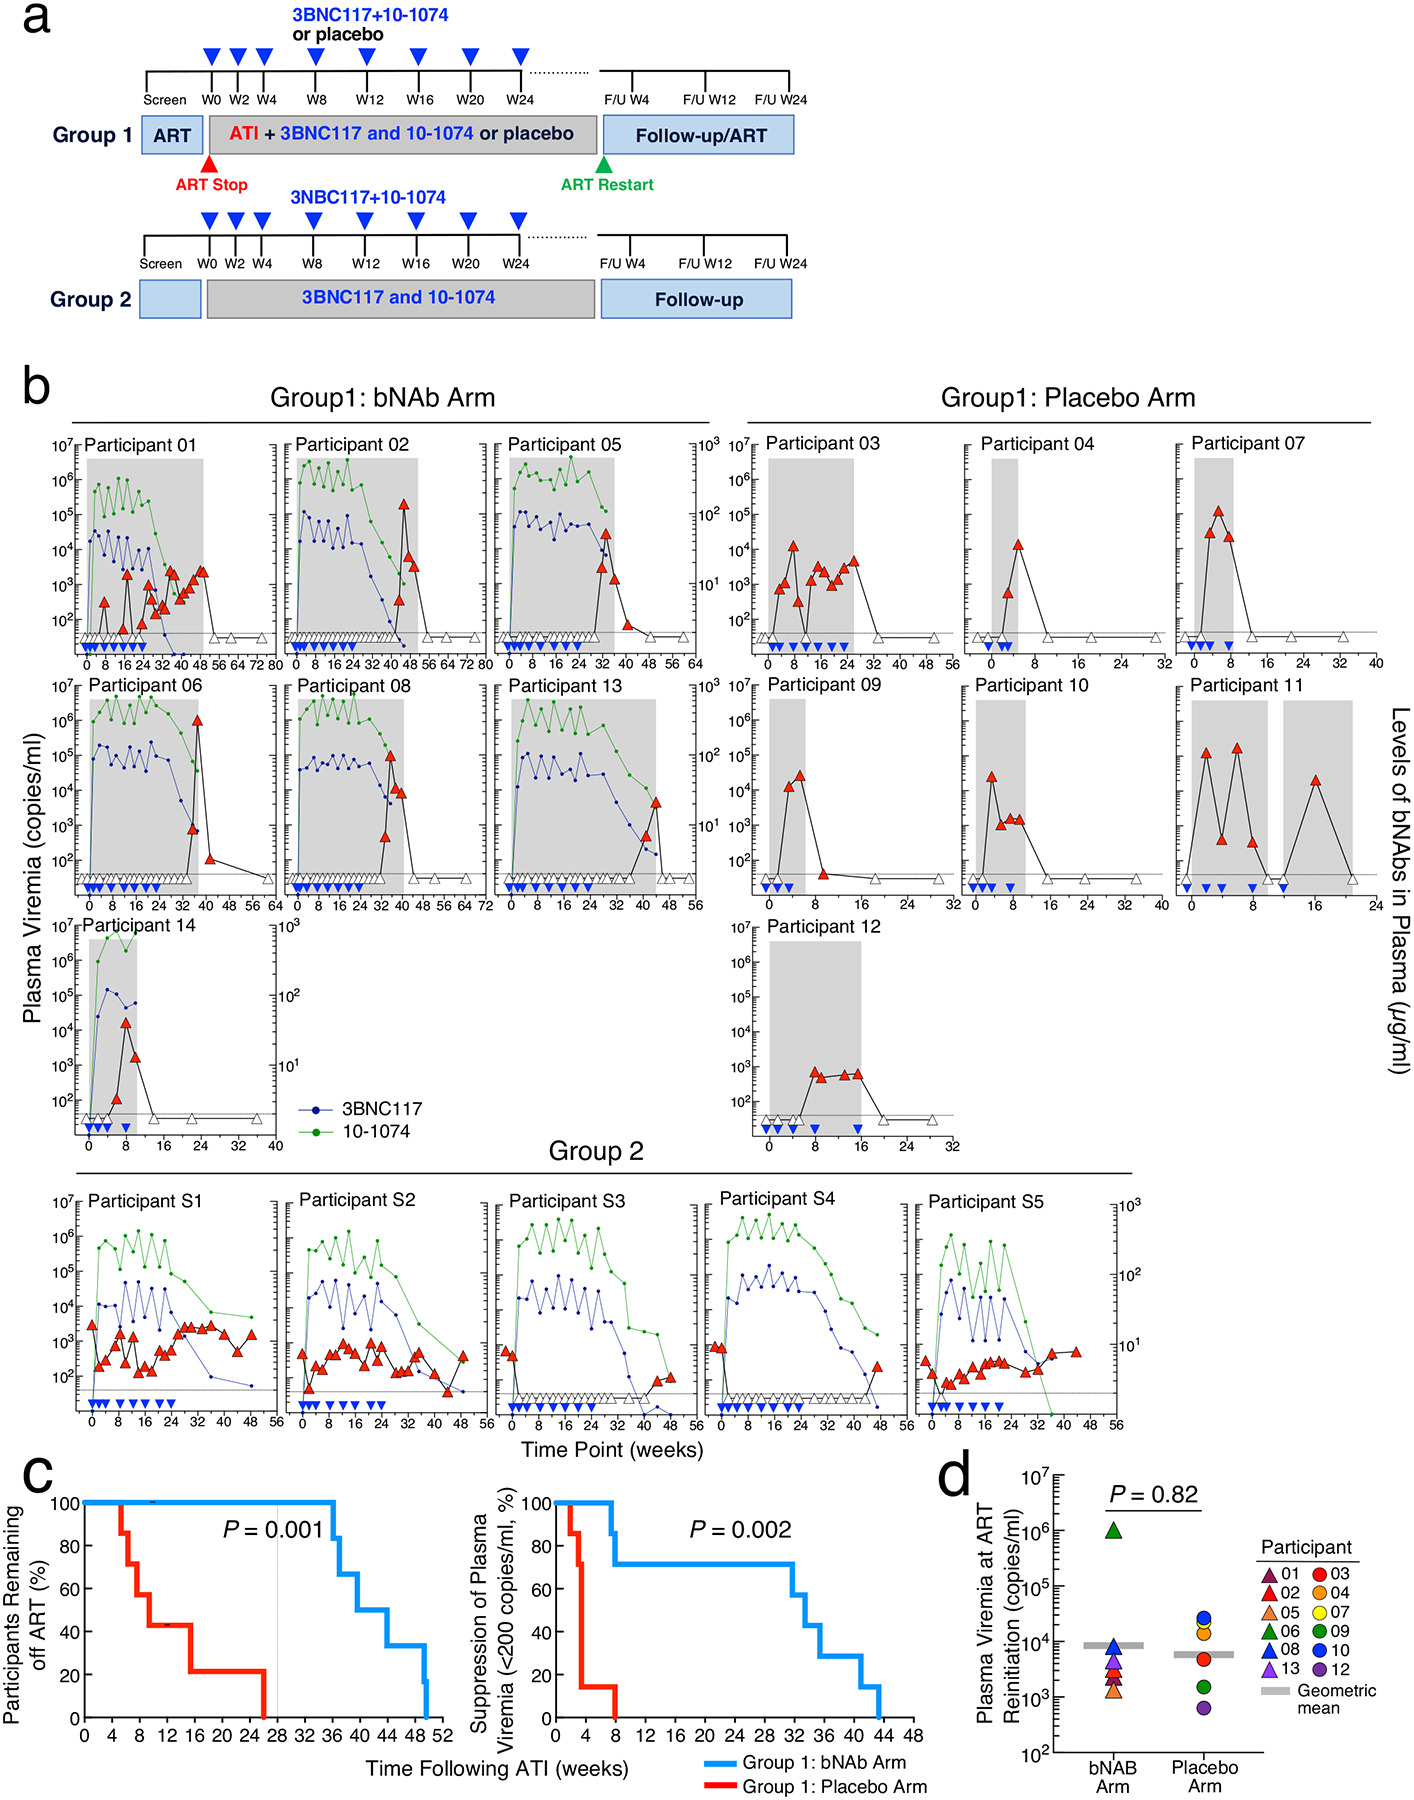
a. Schematics of clinical trial design. The blue triangles indicate infusions of 3BNC117 and 10–1074 or placebo. b. Plasma viremia of study. Participants in Group 1 were randomized to receive either a combination of anti-HIV broadly neutralizing antibodies (bNAbs) 3BNC117 (30mg/kg) and 10–1074 (30mg/kg) (n=7) or placebo (n=7). Antiretroviral therapy (ART) was discontinued 3 days after receiving the first dose of 3BNC117 and 10–1074 or placebo. Group 2 (open-label) consisted of 5 ART-naïve slow progressors. Plasma viremia was monitored every two weeks. The blue triangles indicate time of administration of the antibodies or placebo. The grey shaded boxes indicate duration of ATI. The grey dotted horizontal lines indicate the limit of detection of the assay (40 copies of HIV RNA/ml). The white triangles indicate undetectable plasma viremia (<40 copies of HIV RNA/ml) and the red triangles indicate detectable plasma viremia (≥40 copies of HIV RNA/ml). Plasma antibody concentrations were determined by TZM-bl assay. The dark blue and green circles indicate the plasma concentration of 3BNC117 and 10–1074, respectively. c. Kaplan-Meyer analysis of suppression of plasma viremia after discontinuation of ART in study participants in Group 1. The proportion of study participants remaining off ART during ATI in the bNAb arm was compared to the study participants in the placebo arm (left panel). The vertical dotted line indicates the virologic endpoint. Duration of plasma viremia <200 copies of HIV RNA/ml following discontinuation of ART was compared between the participants in the bNAb arm and the placebo arm (right panel). P values were determined by exact log-rank tests. d. Comparison of plasma viremia at the time of ART reinitiation between the bNAb (n=6) and placebo (n=6) arms in Group 1 study participants. The grey bars represent geometric mean values. The P value was determined using the two-sided Mann-Whitney test.
Effect of bNAbs on virologic parameters
Three days after receiving the first infusion of 3BNC117 and 10–1074 or placebo, the study participants in Group 1 underwent ATI and plasma viremia and CD4+ T cell counts were measured every two weeks (Fig 1a). For Group 1, the protocol pre-defined virologic endpoint was the difference between the bNAb and placebo arms in the number of study participants who experienced plasma viral rebound and met criteria to restart ART prior to study week 28. As shown in Fig. 1b and c, 6 of the 7 study participants in the placebo arm experienced plasma viral rebound and met criteria to restart ART prior to study week 28 compared with none of the 7 participants in the treatment arm. The median duration off ART was 39.6 weeks (range 9.9–49.6) and 9.4 weeks (range 5.3–26) for the Group 1 bNAb and placebo participants, respectively (P = 0.001, Fig. 1c, left panel). Of note, Participant 11, in the placebo arm, who did not meet criteria to restart ART, deviated from the protocol and surreptitiously resumed ART at study week 12 due to concerns about rising plasma viremia. Participant 14, in the bNAb arm, reinitiated ART prior to meeting the restart criteria due to concerns associated with the COVID-19 pandemic. Therefore, the data from these participants were censored for endpoint analysis.
In additional post-hoc analysis, 5 of the 7 study participants in the bNAb arm of Group 1 maintained suppression of plasma viremia (<40 copies/ml), while all study participants in the placebo arm of Group 1 experienced plasma viral rebound within the first 8 weeks of ATI. The median duration of plasma viremia suppression at <200 copies/ml in Group 1 was 33.4 weeks (range 7.4–43.3) and 3.4 weeks (range 1.9–7.9) in the bNAb and placebo arms, respectively (P = 0.002, Fig. 1c, right panel). Of note, two Group 1 bNAb study participants (01 and 14), whose plasma viremia rebounded >200 copies/ml within 8 weeks into ATI, carried bNAb-resistant, replication-competent HIV in their CD4+ T cells at baseline (Fig. 2a). The median duration of suppression of plasma viremia <200 copies/ml for the participants with sensitive virus was 35.4 weeks (range 31.7–43.3). There was no difference in the level of plasma viremia prior to reinitiation of ART between the bNAb and placebo arms in Group 1 study participants (P = 0.82, Fig. 1d), suggesting that bNAb-mediated virologic suppression may not necessarily alter the kinetics of plasma viral rebound after clearance of the antibodies in vivo. In Group 2, 2 of the 5 study participants whose baseline infectious HIV was sensitive to both antibodies maintained complete suppression of plasma viremia for an average of 41.7 weeks (Fig 1b and 2a). Taken together, these results demonstrate that the combination therapy with 3BNC117 and 10–1074 is highly effective in suppressing HIV in the absence of ART for extended periods provided that antibody-resistant virus is not present at baseline.
Fig. 2: Sensitivity of replication-competent HIV to 3BNC117 and 10–1074 and pharmacokinetics.
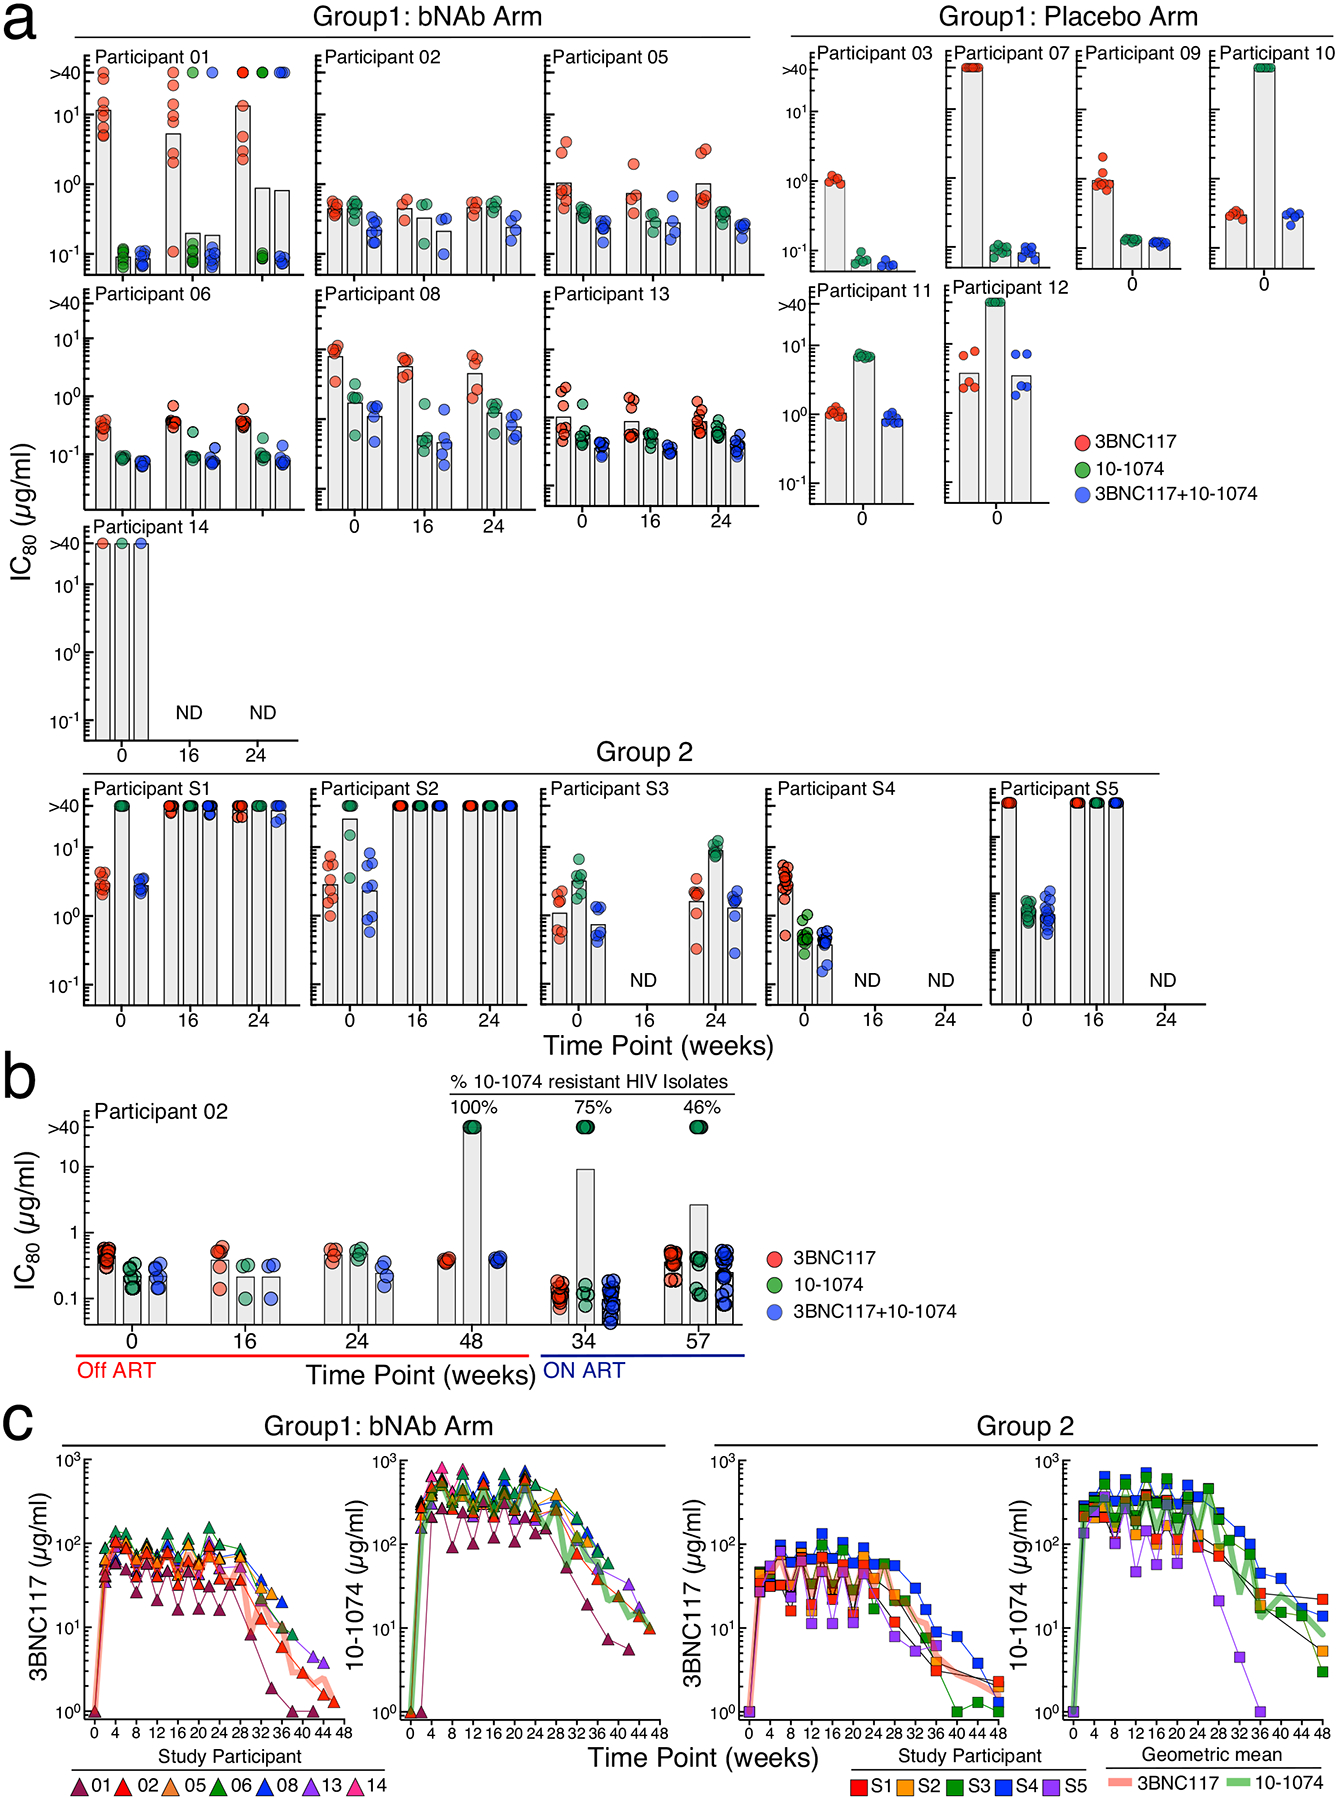
a-b. 80% inhibitory concentrations (IC80) of 3BNC117 and 10–1074 against autologous, replication-competent viral isolates from study participants in the bNAb arm of Group 1 and Group 2. Near clonal replication-competent HIV isolates were generated by coculturing autologous CD4+ T cells with activated CD4+ T cells from healthy HIV-seronegative donors as described in the Methods section. The IC80 concentrations of 3BNC117 and 10–1074 against infectious HIV isolates were determined by the TZM-bl target cell neutralization assay. The grey bars indicate geometric mean values. b. Sensitivity of infectious HIV isolates derived from Participant 02 to 3BNC117 and 10–1074. The IC80 concentrations of 3BNC117 and 10–1074 against replication-competent viral isolates derived during ATI and following reinitiation of ART were determined to examine the decay characteristics of antibody-resistant virus over time. c. Pharmacokinetics of 3BNC117 and 10–1074 in study participants. Plasma levels of 3BNC117 and 10–1074 were determined by a validated luciferase-based neutralization assay in TZM-bl cells. The red and green lines represent geometric mean values of 3BNC117 and 10–1074, respectively.
The sensitivity (80% inhibitory concentration, IC80) of replication-competent HIV isolates to 3BNC117 and 10–1074 was longitudinally monitored in the study participants prior to and following the infusions of bNAbs. At baseline, 38% of study participants in Group 1 had resistant (IC80 >10μg/ml) infectious HIV to either 3BNC117 (3/13 participants, 23%), 10–1074 (3/13 participants, 23%), or both bNAbs (1/13 participants, 8%) (Fig. 2a). There was no evidence that antibody-resistant virus emerged over time for the participants (02, 05, 06, 08, and 13) in the bNAb arm of Group 1 who maintained sustained virologic suppression during ATI (Fig. 2a). Of note, Participant 01, whose baseline virus was largely resistant to 3BNC117, started developing resistance to 10–1074 at Week 16 following ATI. In addition, the baseline virus of Participant 14, whose plasma viremia rebounded >40 copies/ml within 6 weeks following ATI, was highly resistant to both antibodies (Fig. 2a), although only one infectious isolate could be examined due to the extraordinarily low frequency of CD4+ T cells carrying replication-competent HIV. Three of the 5 Group 2 participants, whose baseline CD4+ T cells harbored resistant infectious HIV to either bNAb, did not suppress their plasma viremia and subsequently developed fully resistant virus to both 3BNC117 and 10–1074 (Fig. 2a). Of note, Group 1 bNAb Participant 02, who suppressed plasma viremia for more than 43 weeks in the absence of ART, developed a profound resistance to 10–1074 (but not to 3BNC117) following plasma viral rebound, likely due to a longer half-life of 10–1074 compared to 3BNC117 that resulted in sub-therapeutic concentrations in vivo23 (Fig. 2b). Interestingly, upon reinitiation of ART per protocol in Participant 02, the proportion of CD4+ T cells carrying 10–1074-resistant replication-competent HIV gradually diminished over time, suggesting a natural decay of the viral reservoir carrying 10–1074 resistant virus in the absence of immunologic pressure26. The precise half-life of each antibody could not be assessed in our study due to the unavailability of plasma immediately following each infusion. However, the overall pharmacokinetics observed in our study participants were similar to those of a previous study (Fig. 2c)23. Collectively, our data suggest that bNAb therapy with 3BNC117 and 10–1074 does not lead to a precipitous accumulation of resistant HIV during long-term virologic suppression, provided that antibody-resistant virus was not present at baseline and serum antibody titers remain high.
The levels of CD4+ T cells carrying total HIV DNA, cell-associated HIV RNA, intact proviral DNA, and replication-competent virus were longitudinally monitored in Group 1 bNAb participants whose plasma viremia remained suppressed >30 weeks following ATI (Fig. 3a). No statistical significance was reached when the levels of HIV reservoirs were compared between the two time points (Weeks 0 and 24) (Fig. 3b). In addition, the comparison of fold changes of the size of HIV reservoirs over time between the Group 1 bNAb arm and a cohort of early treated individuals who remained continuous ART28 showed no significant difference (Fig. 3c). These data suggest that the combination bNAbs did not have a significant impact on the persistent HIV reservoir in our study participants although a long-term study involving a much larger cohort would be necessary to definitively address this question.
Fig. 3: Dynamics of HIV reservoirs.
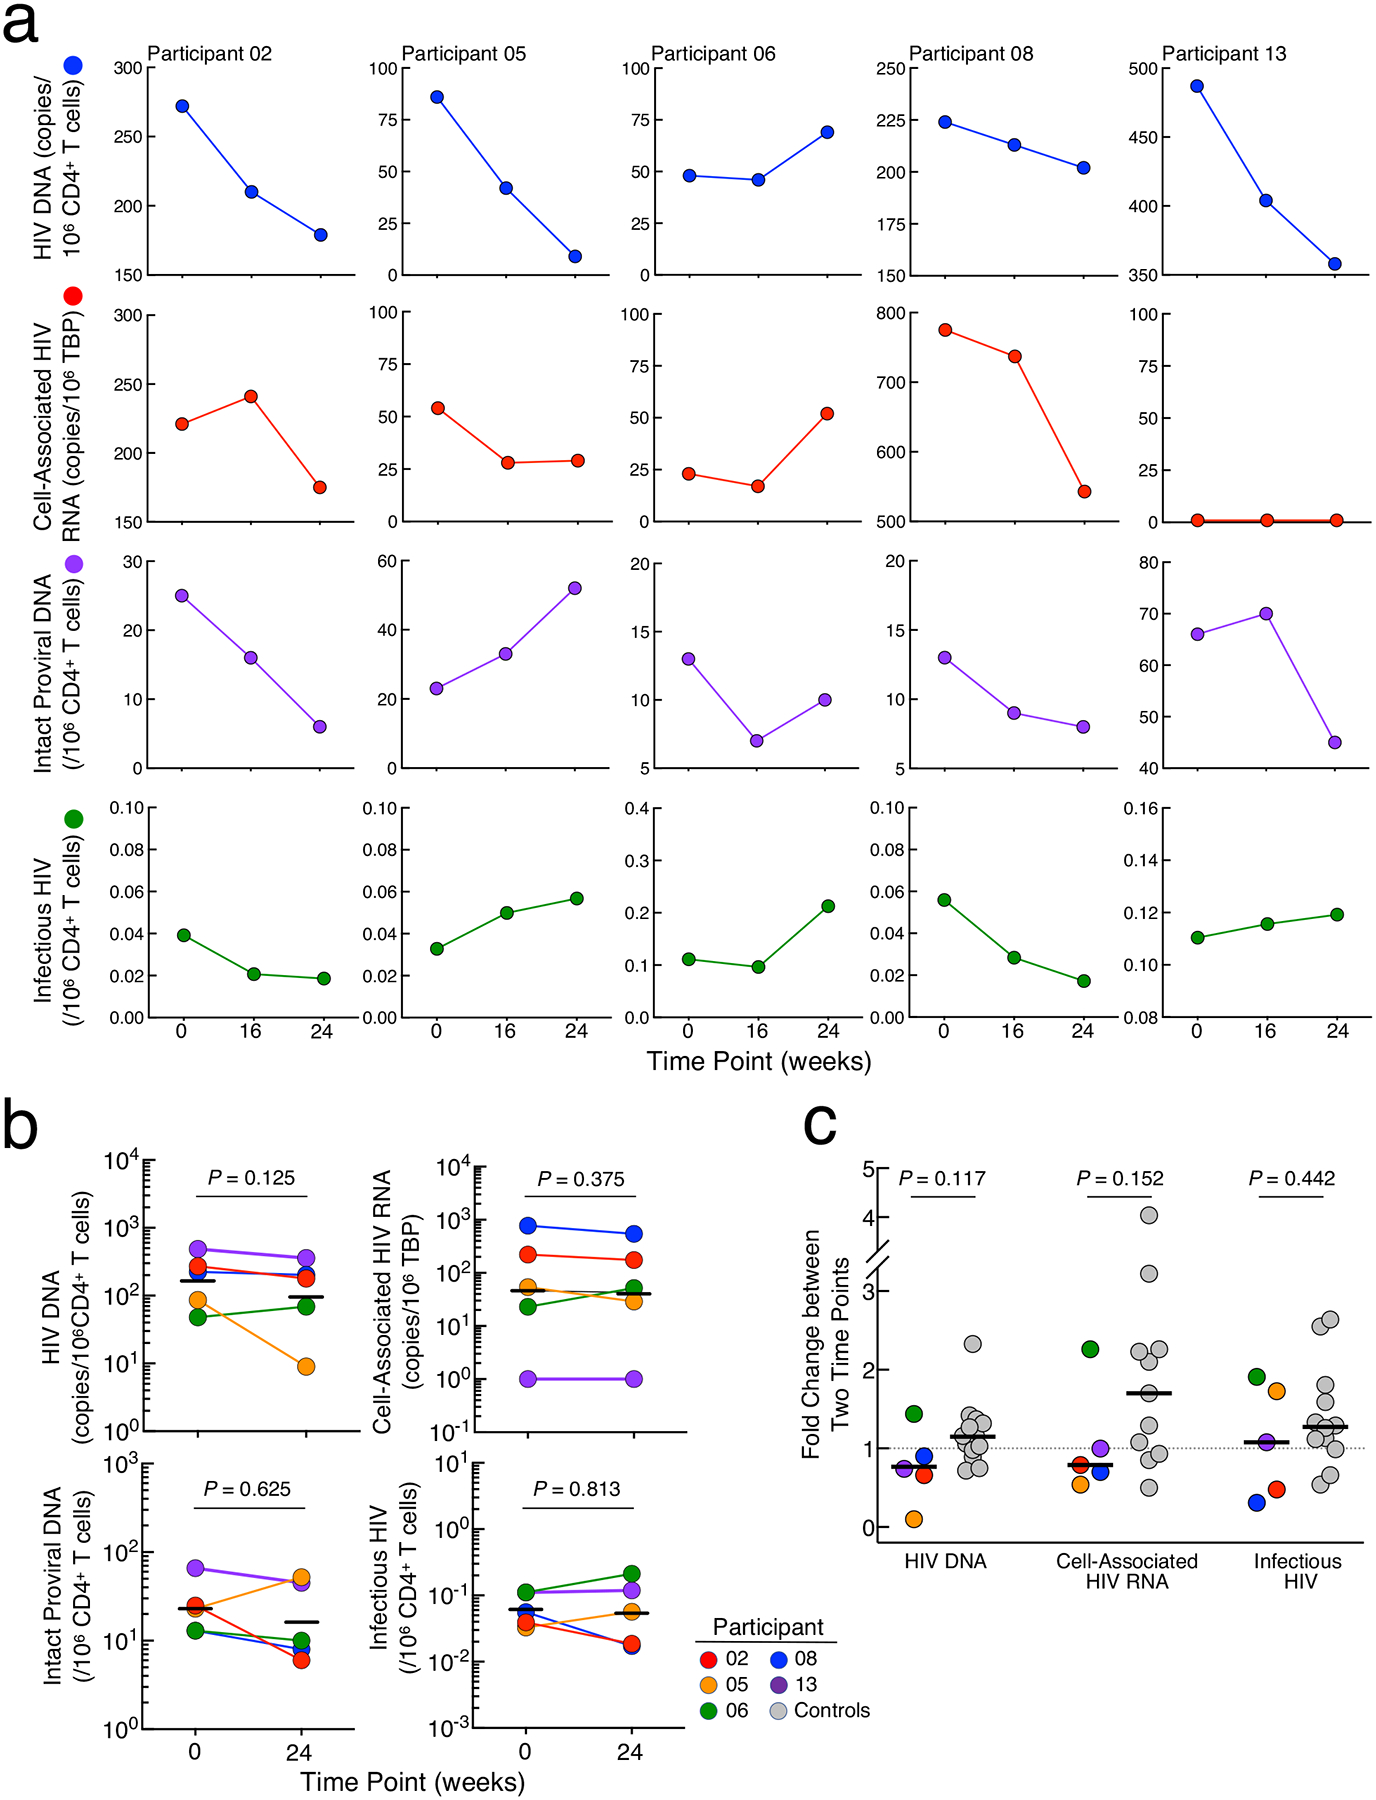
a. Frequencies of CD4+ T cells carrying total HIV DNA, cell-associated HIV RNA, intact proviral DNA, and replication-competent HIV are shown in 5 study participants in the bNAb arm of Group 1 in whom sustained virologic remission was achieved following ATI. b. Dynamics of HIV reservoirs in the CD4+ T cells of Group 1 bNAb study participants (n=5) prior to and following multiple infusions of 3BNC117 and 10–1074. The black lines indicate geometric mean values. Statistical significance was tested with the two-sided Wilcoxon’s matched-pairs signed-rank test. c. Comparison of fold changes in the size of HIV reservoirs over time between the bNAb arm (n=5) and a control cohort of infected individuals (n=13) who initiated ART during the acute/early phase of infection and did not undergo therapeutic interventions or ATI. The black lines indicate median values. The P value was determined using the two-sided Mann-Whitney test.
Effect of bNAbs on immune parameters
Throughout the bNAb infusion periods, the CD4+ T cell counts of all participants, including those in the placebo arm of Group 1, remained stable (Extended Data Fig. 3a). Nonetheless, we considered whether immunologic abnormalities (such as inflammation and exhaustion)29 occurred in study participants who received infusions of combination bNAbs and maintained extended periods of virologic suppression. To this end, we used high-dimensional flow cytometry to longitudinally examine immune parameters in peripheral blood mononuclear cells (PBMCs) of our study participants. Frequencies of TIGIT+, PD-1+, CD38+HLA-DR+, and subsets of CD8+ T cells remained unchanged over time in all groups (Extended Data Fig. 3b). Optimized t-distributed stochastic neighbor embedding (opt-SNE) using high-dimensional mapping of the 21-parameter flow cytometry was conducted to monitor immune cells of the study participants over time (Extended Fig. 4a and b). Fifteen distinct T-cell clusters were identified by FlowSOM30 analyses (Extended Fig. 4a–c). The levels of CD8+ T-cell clusters remained stable over time in all groups (Extended Fig. 4d). Among cytokines (IL-6, IL-8, TNF-α), chemokines (MIP-1ß and RANTES), and markers of immune activation (IL-2Rα, CD40, PD-L1, IP-10, c-reactive protein, and d-dimer) measured in the plasma of study participants between Week 0 and Week 24, all remained unchanged in all groups (Extended Data Fig. 5). Taken together, our data suggest that significant immunologic abnormalities, as assessed by cellular phenotypes and plasma biomarkers, did not arise during prolonged ATI in study participants in whom the bNAb-mediated virologic suppression was achieved.
Previous studies have demonstrated that passive transfer of bNAbs in SIV-infected animals24,31 and HIV-infected humans25,26, including individuals whose plasma viremia was controlled by bNAbs in the absence of ART27, could potentially lead to enhanced anti-viral immunity. In humans, HIV Gag specific CD4+ and CD8+ T cell responses peaked at week 6/7 and were no longer significant by week 1827. We longitudinally examined HIV-specific CD8+ T cells in our study participants by performing intracellular cytokine staining following stimulation with a pool of overlapping HIV Gag peptides and molecular analyses of the HIV-specific CD8+ T cell receptor (TCR) repertoire. The level of polyfunctional (IFN-γ+TNF-α+MIP-1ß+) HIV Gag-specific CD8+ T cells remained unchanged in Group 1 bNAb and Group 2 participants (Extended Data Fig. 6a). A modest increase in the frequency of HIV-specific CD8+ T cells was observed over time in the Group 1 placebo participants, likely due to the rising plasma viremia following ATI (Extended Data Fig. 6a). To gain further insight into the impact of combination bNAbs on HIV-specific T cells at the molecular level, we conducted longitudinal deep sequencing of TCR genes using genomic DNA isolated from highly enriched CD8+ T cells. The average breadth of HIV-specific CD8+ TCR clonotypes remained stable in Group 1 bNAb participants (Extended Data Fig. 6b). A modest increase, although statistically not significant (P = 0.062), in the depth of HIV-specific CD8+ TCR clonotypes was observed in these participants following passive transfer of the bNAbs. Of note, the breadth and depth of HIV-specific CD8+ TCR clonotypes in Group 1 placebo participants remained largely unchanged over time. There was a modest increase, although statistically not significant (P = 0.062), in the breadth of HIV-specific CD8+ TCR clonotypes in Group 2 over time, possibly due to ongoing viral replication in 3 of the 5 participants. To further interrogate the changes in the TCR repertoires of study participants, we compared the frequencies of the HIV-specific clonotypes at three different time points. For each group, the frequencies of the clonotypes present in the top 25 comparisons (Supplemental Table 3) that were ranked based on statistical significance and the usage levels of the TRBV-TRBJ gene pairs in these clonotypes (Supplemental Table 4) were used to conduct principal component analysis (PCA). Based on the clonotype frequencies and gene usage levels, two reduced states for each TCR repertoire were computed. The variability of both repertoire states decreased at Week 24 over Week 0 among the study participants in the bNAb arm of Group 1, as illustrated by the smaller-sized ellipses over time (Extended Data Fig. 6b). A larger study involving multiple infusions of bNAbs and extended periods of follow-up will be necessary to confirm these findings.
Discussion
Despite decades of intensive research, prospects of achieving an HIV cure as manifested by eradication of the virus remain elusive2. A more realistic alternative to a cure may be through immune-based therapies aimed at achieving maximal virologic suppression without the need for life-long and predominantly daily ART and without the need to eliminate the persistent HIV reservoir in infected individuals32,33. To date, one of the most promising and realistic approaches for accomplishing these outcomes is by infrequent passive infusions of combination HIV-specific bNAbs15–18. Numerous HIV-specific bNAbs have been isolated in recent years16,17,34,35 and more than a dozen of them, either as single or combination therapies, have been tested in humans for safety and therapeutic efficacy15. However, while certain bNAbs have been shown to be highly effective in neutralizing HIV in vitro by standardized assays involving large panels of HIV Env-pseudotyped viruses35, it is becoming increasingly clear that durable and ART-free virologic suppression will require a combination (two or more) of antibodies together with screening for bNAb resistance to the pre-existing virus in infected individuals19,22. The data obtained from our clinical trial, the first randomized study involving participants in whom ART was initiated during the acute/early phase of infection with the longest duration of follow-up, clearly demonstrated that complete and sustained virologic suppression is achievable with intermittent administration of combination bNAbs. However, the combination bNAbs were ineffective in maintaining suppression of plasma viremia in 2 of 7 study participants in our small cohort in whom replication-competent HIV at baseline exhibited resistance to one or both antibodies. This will potentially pose a significant challenge for the treatment of HIV-infected individuals with bNAbs on a large scale. Nonetheless, our findings revealed several positive outcomes. Over the course of 24 weeks of virologic suppression in study participants who received the combination bNAbs, there were no significant immunologic or virologic alterations, such as increases in immune activation and exhaustion or the size of HIV reservoirs. A recent study has demonstrated that combination bNAbs could further augment T-cell responses against HIV in infected individuals while suppressing their plasma viremia27. Although we did not observe any significant changes in the frequency of HIV-specific polyfunctional CD8+ T cells in our study, further studies with early and frequent time points27, as well as detailed assessments of virus-specific proliferative and cytotoxic effector functions36, may be needed to fully delineate the role of T cells in bNAb therapeutics. It is also plausible that the profound virologic suppression mediated by the bNAbs in our study cohort (those who initiated ART during the acute/early phase of infection), combined with their relatively low HIV reservoir burden at baseline, may have prevented formation of immune complexes18 and/or residual levels of viral expression needed for the induction of robust anti-viral T-cell responses33,37. It also remains to be fully elucidated whether additional benefits of bNAbs, aside from their ability to neutralize HIV and maintain viral suppression in the absence of ART, can ultimately alter the course of infection (i.e., long-term suppression of plasma viremia in the absence of both bNAbs and ART) after clearance of the antibodies in vivo. Although a larger study involving multiple infusions of bNAbs and extended periods of follow-up will be necessary to address this question, our data strongly suggest that the virus will ultimately rebound upon bNAb clearance after 24 weeks of bNAb therapy. In this regard, future trials may need to incorporate a pre-specified ART initiation shortly after the last infusion of bNAbs in order to prevent the emergence of antibody-resistant virus in study participants.
One of the major confounding factors of this study is a small sample size, and therefore, it is imperative to conduct a much larger study involving study participants in whom ART was initiated during the acute/early phase of infection to confirm our findings. Other major caveats of our study include the lack of lymphoid tissue analyses and the limited number of infusions (up to 8). Nonetheless, our findings offer clear evidence that a combination bNAb therapy in HIV-infected individuals is safe and well-tolerated and, for those with antibody-sensitive virus, offers profound virologic suppression without any significant or unforeseen immunologic and virologic anomalies. As the next generation of bNAbs with increased breadth and prolonged half-lives (>60 days)15,17,35 become available, there is a reason to believe that the infrequent administration (i.e., twice a year) of such antibodies, possibly along with a long-acting injectable antiretroviral drug12–14, could lead to ART-free HIV suppression for extended periods (years) in infected individuals.
Methods
Study design, participants, and procedures
The purpose of this clinical trial was to assess the safety, tolerability, and virologic efficacy of a combination of two bNAbs 3BNC117 and 10–1074 in HIV-infected individuals. The study consisted of two components: a randomized, double-blind, placebo-controlled trial (Group 1) and an open label, single arm trial (Group 2). Study inclusion criteria for Group 1 included institution of ART within 12 weeks of being diagnosed with acute or early HIV infection, CD4+ T cell count >450 cells/μl at screening, continuous ART treatment with suppression of plasma viremia below the limit of detection for ≥1 year, and in general good health. Participants who had previously participated in an ATI study were not excluded. Acute infection was defined as a plasma viremia greater than 2,000 copies of HIV RNA/ml with a negative HIV-1 enzyme immunoassay (EIA; criterion 1), a positive result from an HIV-1 EIA with a negative or indeterminate HIV-1 Western blot that subsequently evolves to a confirmed positive result (criterion 2), or negative result from an HIV-1 EIA within the past 4 months and plasma viremia greater than 400,000 copies/ml in the setting of a potential exposure to HIV-1 (criterion 3). Early infection was defined as a negative result from an HIV-1 EIA within 6 months before a positive result from an HIV-1 EIA and confirmatory HIV-1 Western blot (criterion 4), a negative result from a rapid HIV-1 test within 1 month before a positive result from an HIV-1 EIA and Western blot (criterion 5), or the presence of low level of HIV antibodies as determined by having a positive EIA and Western blot with a nonreactive detuned EIA according to a multi-assay testing algorithm for recent infection (criterion 6). Study inclusion criteria for Group 2 included no ART within 24 months, plasma viremia between 200–5,000 copies/ml, and at least two documented plasma viremia ≥200 copies/ml on at least two occasions in the 12 months prior to screening. The predetermined primary endpoint of the study was the rate of occurrence of grade 3 or higher AE or SAEs which were probably or definitely related to the study antibodies. AEs were determined according to the Division of AIDS Table for Grading the Severity of Adult and Pediatric Adverse Events, Version 2.1. The virologic endpoints were the number of study participants who experienced plasma viral rebound following ATI and who met criteria to restart ART before study week 28 (Group 1) or the number of study participants who achieved sustained suppression of plasma viremia by study week 28 (Group 2).
Study participants in Group 1 were randomized to receive multiple (up to 8) infusions of 3BNC117 (30mg/kg body weight) and 10–1074 (30mg/kg body weight) or placebo during the 24-week period. One study participant (Participant 05) whose regimen contained a non-nucleoside reverse transcriptase inhibitor (NNRTI) was switched to an integrase inhibitor-based regimen 2 weeks prior to ATI due to the long half-life of NNRTIs. The study participants in Group 1 discontinued ART 3 days after the first infusion of 3BNC117 and 10–1074 or placebo. The protocol investigators and study participants in Group 1 were blinded to treatment assignments for the duration of study. All study participants in Group 2 received up to 8 infusions of 3BNC117 (30mg/kg body weight) and 10–1074 (30 mg/kg body weight) during the 24-week period. Study participants received sequential 3BNC117 and 10–1074 intravenously according to body weight over a 60-minute period per antibody. Plasma viremia and CD4+ T cell count were monitored every 2 weeks. Plasma viremia was determined by Abbott Real-Time HIV-1 assay with a detection limit of 40 copies of HIV RNA per ml. Study participants in Group 1 discontinued antibody infusions or placebo and reinitiated ART if they met one of more of the following criteria during the ATI phase: 1) a confirmed >30% decline in baseline CD4+ T cell count, 2) an absolute CD4+ T cell count <350 cells/μl, or 3) sustained plasma viremia >1,000 copies/ml greater than 4 weeks. Study participants in Group 2 discontinued antibody infusions if their CD4+ T cells declined as specified above or they had an increase in baseline plasma viremia >0.5 log10.
Blood and leukapheresed products were collected in accordance with protocols approved by the Institutional Review Board of the National Institute of Allergy and Infectious Diseases, National Institutes of Health (ClinicalTrials.gov Identifier NCT03571204). All subjects provided written informed consent.
Measurements of IC80
Near clonal replication-competent HIV isolates were derived from coculturing enriched CD4+ T cells of study participants with CD8-depleted anti-CD3 stimulated PBMCs from HIV-seronegative donors as described below. The concentration of each infectious viral isolate was initially determined by HIV p24 ELISA. Each isolate was titrated using a standard TZM-bl target cell assay. In order to determine IC80 concentrations of both antibodies to reservoir-derived replication-competent HIV over time, each viral isolate was incubated with serially diluted (40, 10, 2.5, 0.625, 0.156, 0.039μg/ml in duplicate) 3BNC117 and/or 10–1074 for 90 minutes followed by incubation with TZM-bl cells for 48 hours. Cells were then lysed and substrate (Promega) was added to measure the luciferase activity (SparkControl, Version 3.1, TECAN).
Pharmacokinetics of 3BNC117 and 10–1074
Levels of 3BNC117 and 10–1074 in plasma of study participants were longitudinally measured using a validated luciferase-based neutralization assay in TZM-bl cells as previously described38. Briefly, plasma samples were tested in duplicate using a primary 1:20 dilution with 5-fold titration series and tested against HIV Env pseudotyped viruses Q461.e2 (3BNC117-sensitive/10–1074-resistant) and Du422.1 (10–1074-sensitive/3BNC117-resistant). Pseudotyped virus with murine leukemia virus (MuLV) Env was used as a negative control. 3BNC117 and 10–1074 clinical drug products were utilized as positive controls and tested using a primary concentration of 10μg/ml with five-fold serial dilution series. Plasma concentrations (μg/ml) of 3BNC117 and 10–1074 were determined as follows: plasma 50% inhibitory dilution (ID50) titer (dilution) X IC50 titer (μg/ml) of 3BNC117 or 10–1074.
Quantitation of HIV reservoirs
The frequency of CD4+ T cells carrying total HIV DNA was determined by droplet digital PCR as previously described39. Briefly, genomic DNA was isolated from highly enriched CD4+ T cells using the Puregene DNA extraction kit (Qiagen) and digested with restriction enzyme MscI (New England BioLabs). Subsequently, the digested genomic DNA was subjected to the droplet digital PCR (QuantaSoft, Version 1.7.4.0917, Bio-Rad Laboratories) according to the manufacturer’s instructions. The following PCR primers and probe were used for amplification of 5’LTR region of HIV DNA: forward primer 5′-GRAACCCACTGCTTAAGCCTCAA-3′ (nt 506–528 in HXB2 K03455.1), reverse primer 5′-TGTTCGGGCGCCACTGCTAGAGA-3′ (nt 648–626), and probe 5′-6FAM-AGTAGTGTGTGCCCGTCTGTT-IABkFQ-3′ (nt 552–572). The following PCR primers and probe were used for amplification of the housekeeping gene RPP30: forward primer 5′-GATTTGGACCTGCGAGCG-3′ (nt 29–46 in NM_001104546.2), reverse primer 5′-GCGGCTGTCTCCACAAGT-3′ (nt 90–73), and probe 5′-HEX-TTCTGACCTGAAGGCTCTGCGC-IABkFQ-3′ (nt 49–70). Copy numbers of HIV DNA were normalized per 1×10⁶ CD4+ T cells.
The level of CD4+ T cell-associated HIV RNA was determined by RT-PCR. Total RNA was isolated from highly enriched CD4+ T cells using RNeasy Mini kit (Qiagen), followed by synthesis of complementary DNA (cDNA) using qScript XLT cDNA Master Mix (Quanta Biosciences) according to the manufacturer’s instructions. cDNA was subjected to the droplet digital PCR (Bio-Rad Laboratories) using the following primers: HIV-specific primers HIV-US-F (5′-TCTCTAGCAGTGGCGCCCGAACA-3′, nt 626–648), HIV-US-R (5′-TCTCCTTCTAGCCTCCGCTAGTC-3′, nt 786–764) and HIV-US-probe (5′−6FAM-CAAGCCGAGTCCTGCGTCGAGAG-IABkFQ-3′, nt 705–683); and TATA box–binding protein (TBP; housekeeping gene)-specific primers TBP-F (5′-CACGAACCACGGCACTGATT-3′, nt 863–882 in NM_003194.5) and TBP-R (5′-TTTTCTTGCTGCCAGTCTGGAC-3′, nt 951–930) and TBP-probe (5′-HEX-TGTGCACAGGAGCCAAGAGTGAAGA/3-IABkFQ-3′, nt 902–926). Copy numbers of cell-associated HIV RNA were normalized per 1×10⁶ copies of TBP.
The frequency of CD4+ T cells carrying intact HIV proviruses was determined by Intact Proviral DNA Assay (IPDA) as previously described40.
The level of CD4+ T cells carrying replication-competent HIV was determined by quantitative co-culture assay using serially diluted and replicates of 5×10⁶ CD4+ T cells as previously described42. Highly enriched CD4+ T cells were incubated with anti-CD3 antibody and irradiated PBMCs from healthy HIV-negative donors. After one day incubation, 1×10⁶ CD8-depleted and anti-CD3-stimulated PBMCs from HIV-negative donors were added to each well, followed by periodic removal of cell suspensions and replenishment with fresh medium containing IL-2. Subsequently, HIV p24 enzyme-linked immunosorbent assay (ELISA) was performed on the culture supernatants to identify wells containing replication-competent HIV. The infectious units per million cells from quantitative coculture assays were determined as previously described41.
Phenotypic characterization of immune cells by flow cytometry
Cryopreserved PBMCs were thawed, washed, and stained with the viability reagent Zombie NIR (Biolegend #423106) and fluorophore-conjugated antibodies in Brilliant Stain Buffer Plus (BD #566385). Flow cytometric data were acquired on a Cytek Aurora cytometer using the SpectroFlo Software (Cytek Biosciences) and analyzed using FlowJo version 10.7.1, and OMIQ platform (www.Omiq.ai).
High-dimensional data analysis of flow cytometry data
Opt-SNE and FlowSOM analyses were conducted using OMIQ software (Omiq.ai). Opt-SNE analysis was performed using equal sampling of 100,000 CD3+ T cells from each FCS file, with 1,000 iterations, a perplexity of 30, and a theta of 0.5. The following immune markers were used to generate opt-SNE maps: CD4, CD8, CD45RA, CCR7, CD27, CD28, CD38, HLA-DR, CD226, TIGIT, PD-1, 2B4, CD160, CTLA-4, CD96, OX40, CXCR5, ICOS, and 4–1BB. Resulting opt-SNE maps were used for the FlowSOM algorithm. The self-organizing map (SOM) was generated using hierarchical consensus clustering and 15 meta-clusters were identified. Heatmap displaying column-scaled z-scores of mean fluorescent intensity (MFI) for individual FlowSOM clusters was generated using OMIQ platform.
Intracellular cytokine staining (ICS) assay
The frequency of virus-specific CD8+ T cells was assessed by incubating PBMCs with a pool of HIV-1 consensus B Gag overlapping peptides (NIH AIDS Reagent Program) with Brefeldin A (Sigma Aldrich) for 6 hours at 37°C. Unstimulated cells were used as a negative control for background subtraction. Cells were stained with Zombie NIR (Biolegend #423106) and antibodies to immune markers (Supplementary Table 5). Cells were then fixed with 1x Lysing Solution (BD Biosciences) and permeabilized with 1x Permeabilization Solution 2 (BD Biosciences). After washing, cells were stained with the antibodies to the intracellular cytokines and chemokines (Supplementary Table 5 and Supplementary Fig. 1). Data were acquired on a Cytek Aurora cytometer using the SpectroFlo Software (Cytek Biosciences) and analyzed using FlowJo version 10.7.1.
T cell receptor repertoire analysis
Complementarity determining regions (CDR) 3 of TCR β-chains present in highly enriched CD8+ T cells of study participants were sequenced in a high-throughput manner using the immunoSEQ assay42,43 after amplification of the extracted DNA in a bias-controlled multiplex PCR. The resulting CDR3 sequences were collapsed and filtered to quantify the absolute abundance and frequency of each unique TCR β region with immunoSEQ Analyzer (Adaptive Biotechnologies)44. TCR repertoire statistics, including gene usage (fraction of clonotypes in which a given TRBV or TRBJ gene is present), were computed using the Immunarch45. TCR sequencing data are available at https://clients.adaptivebiotech.com/login (login: chun-review@adaptivebiotech.com and password: chun2021review). HIV-specific breadth and depth were computed by utilizing the HIV-specific CDR3 sequences previously reported in the literature from four databases, namely the immune epitope database (IEDB)46, VDJdb47, McPAS-TCR48, and Pan immune repertoire database (PIRD)49. The reported breadth values represent the fraction of clonotypes in each repertoire that are HIV-specific, whereas depth calculations take abundance of each clonotype into account, such that each HIV-specific clonotype impacts the overall HIV-specific depth (per sample) with a magnitude proportional to its abundance.
Measurements of biomarkers in plasma
Levels of biomarkers in plasma were determined using the ELLA platform (Simple Plex Runner, Version 3.7.2.0, ProteinSimple) per the manufacturer’s instructions.
Statistical analysis
P values for the virologic endpoints (Group 1) were determined using exact log-rank tests. Sensitivity analyses were performed to handle the two study participants (11 and 14) who reinitiated ART prior to meeting the restart criteria. Two independent analyses, with and without censoring the data from the above study participants, generated the same P values. P values for paired and unpaired comparisons were computed using the Wilcoxon signed rank test and Mann-Whitney test, respectively, using Prism 9.1 (GraphPad). P values computed in the TCR repertoire analysis were determined by the Wilcoxon signed rank test (paired) and Mann-Whitney test (unpaired) using the R package ggpubr50. The factoMineR51 package in R was used to perform principal component analysis (PCA) with the TCR repertoire data.
Extended Data
Extended Data Fig. 1: Consolidated Standards of Reporting Trials (CONSORT) flow diagram for the trial.
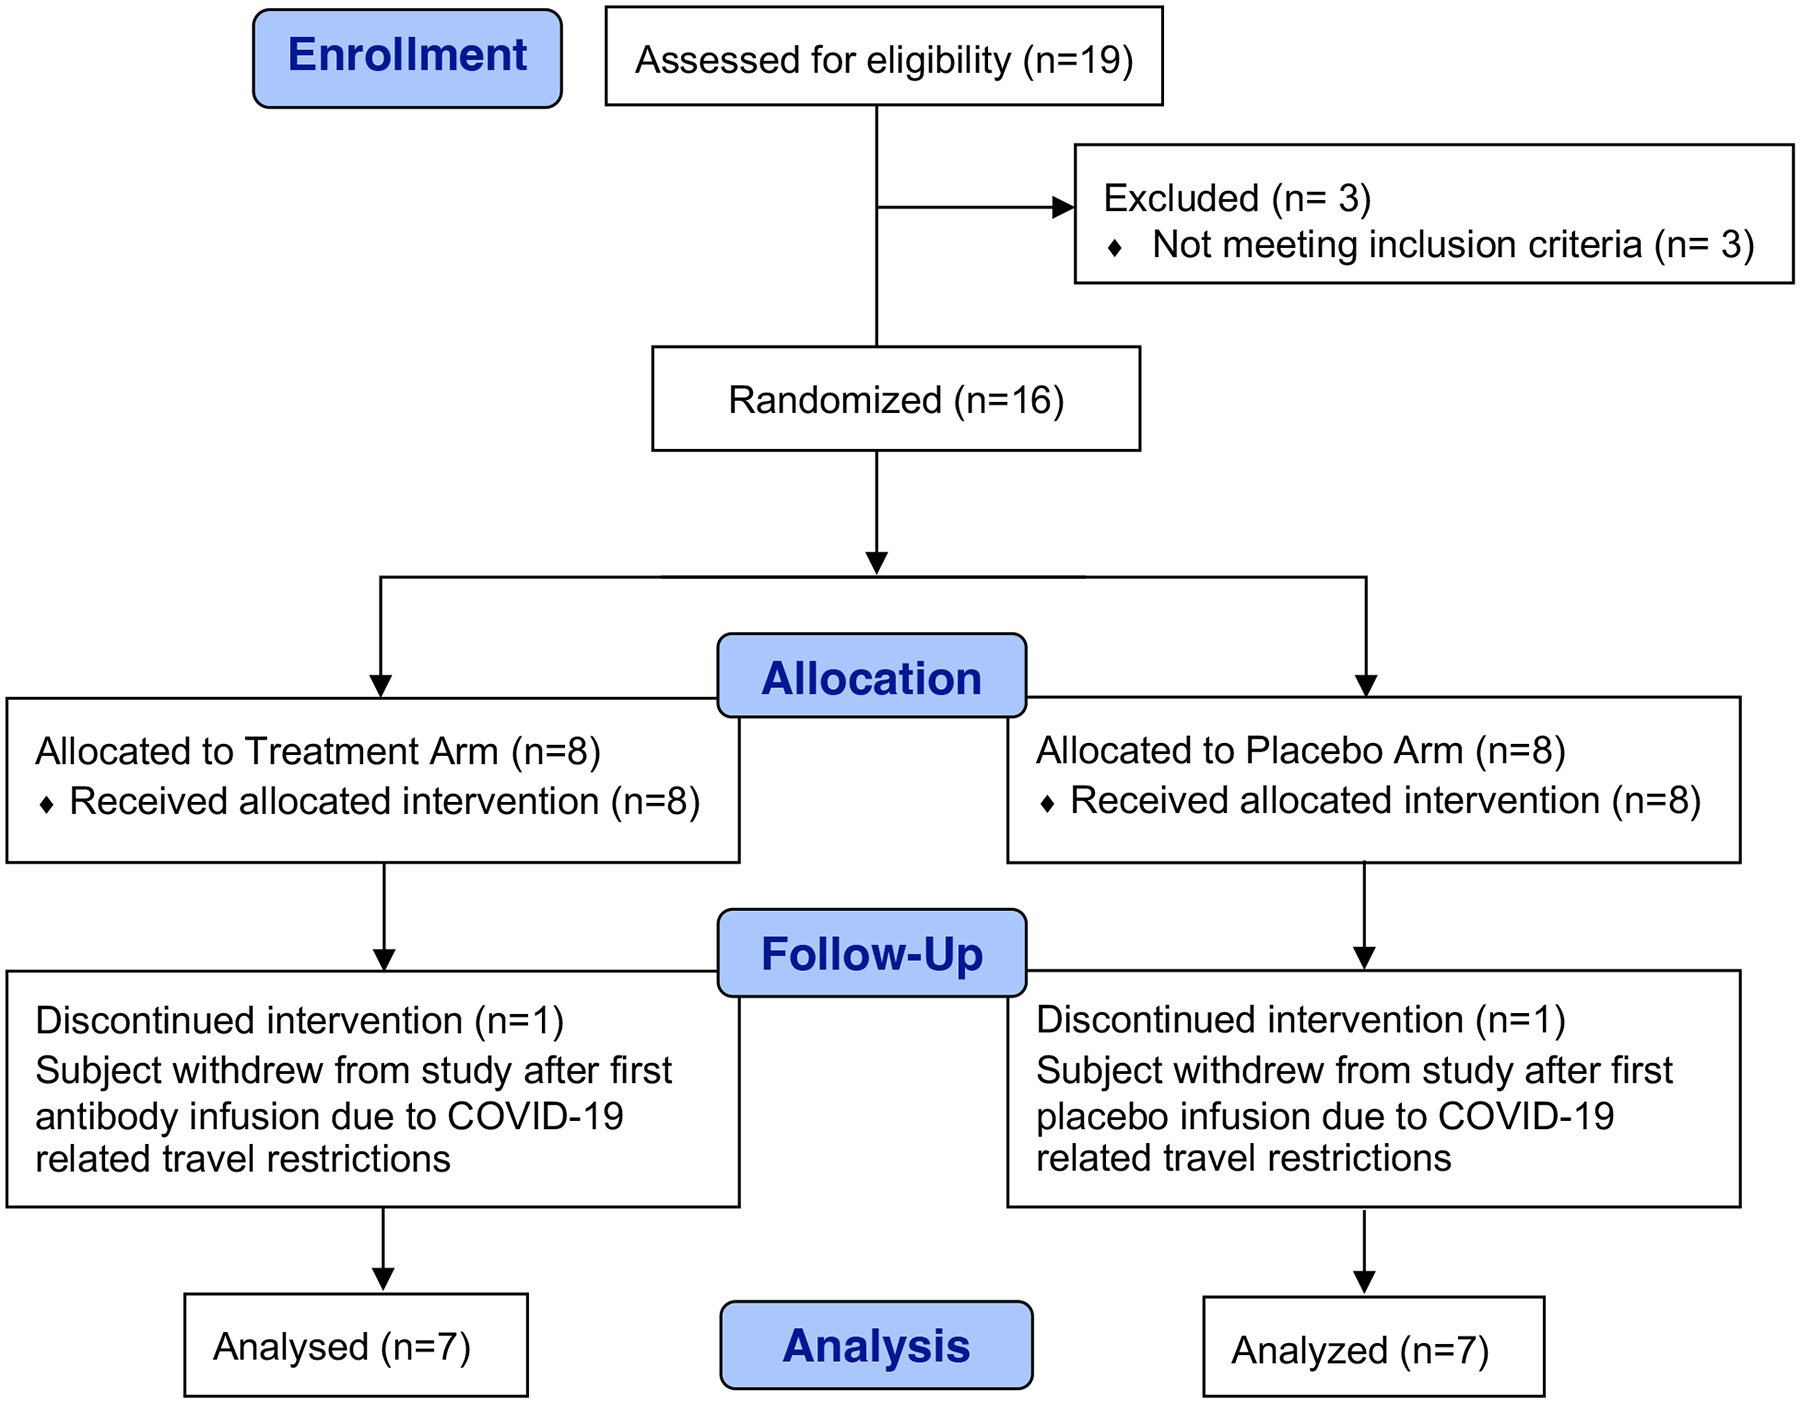
CONSORT diagram shows the study enrollment of 14 participants who underwent randomization to the bNAb or placebo groups.
Extended Data Fig. 2: Dynamics of HIV reservoirs.
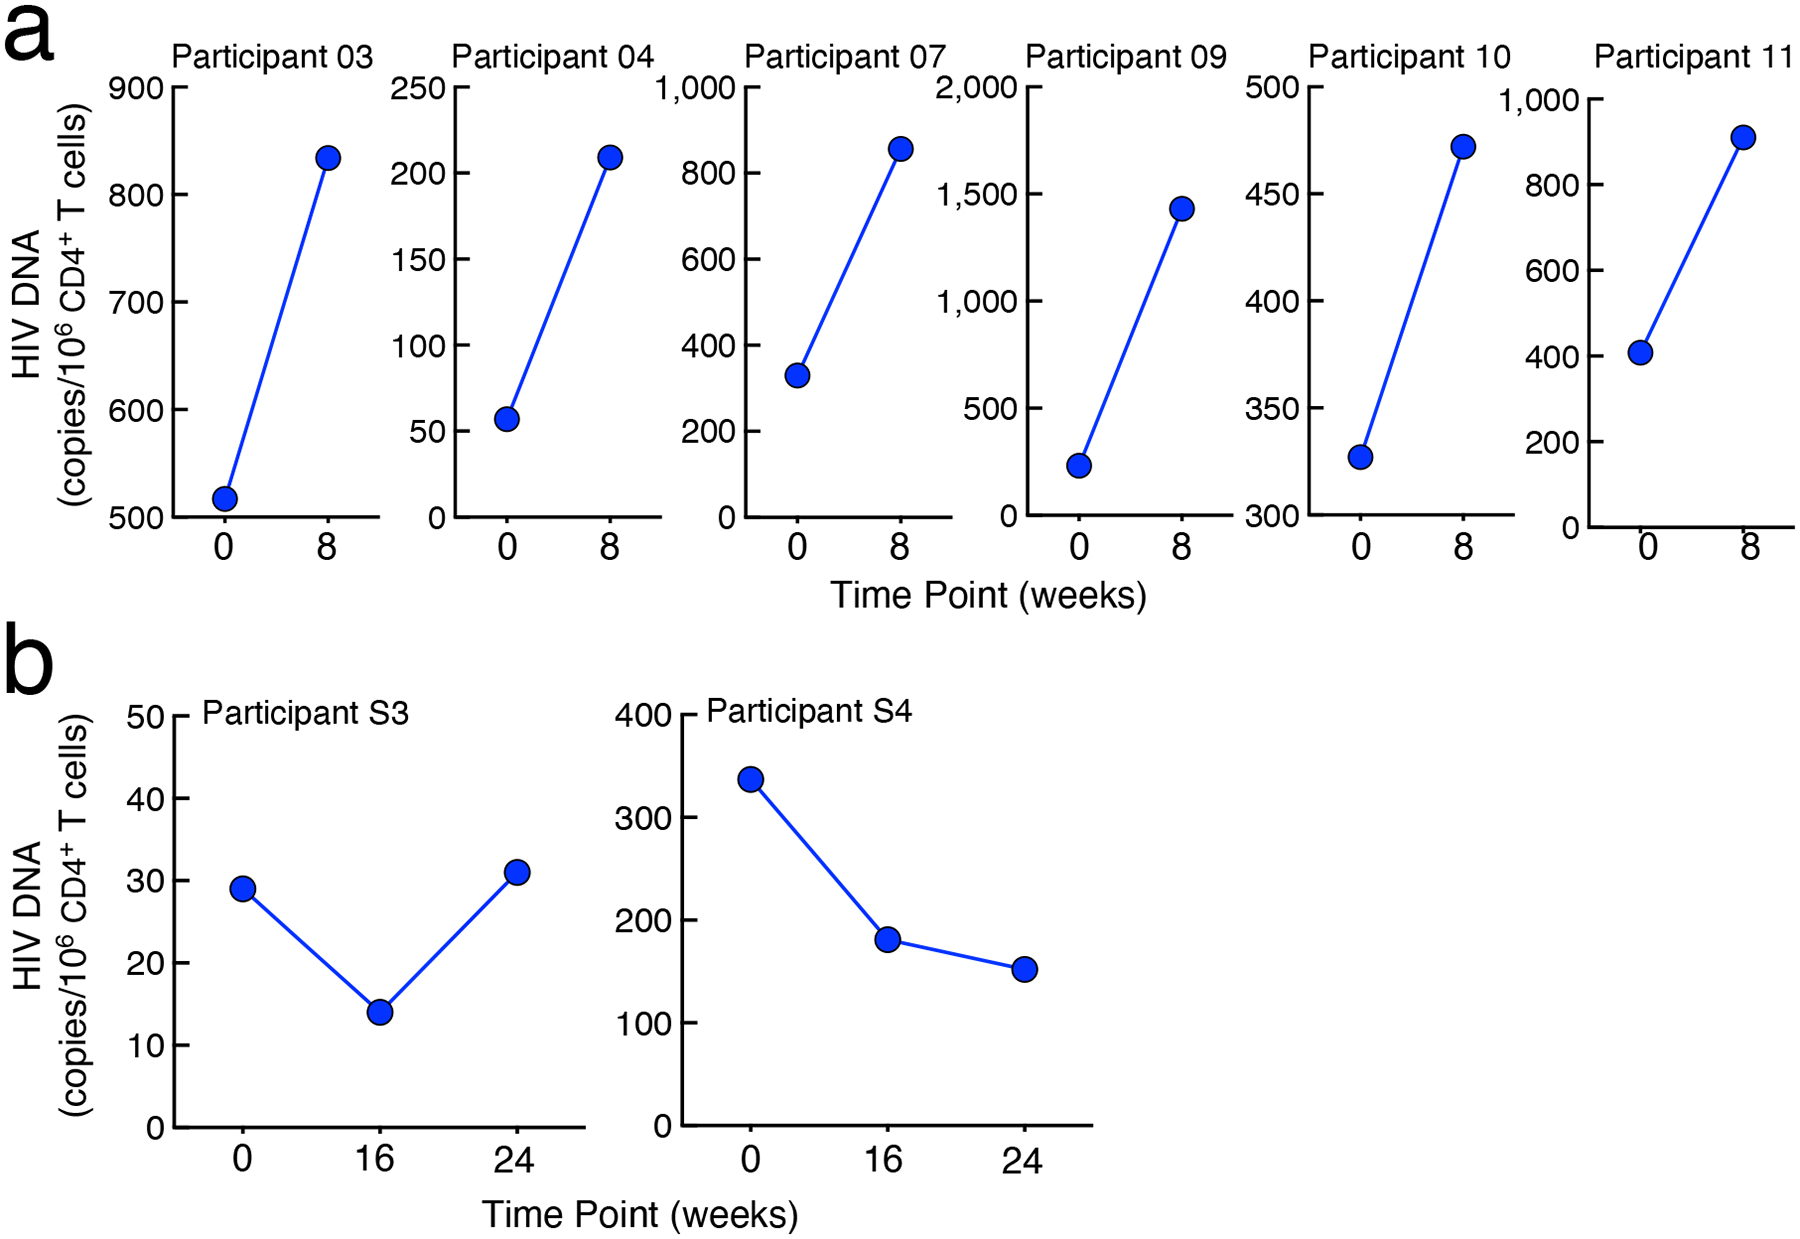
a. Frequencies of CD4+ T cells carrying total HIV DNA in study participants in the placebo arm of Group 1. b. Frequencies of CD4+ T cells carrying total HIV DNA in study participants in the Group 2 in whom plasma viremia was suppressed by the combination bNAbs.
Extended Data Fig. 3: Longitudinal measurements of CD4+ T cell counts and phenotypic analyses of CD8+ T cells.
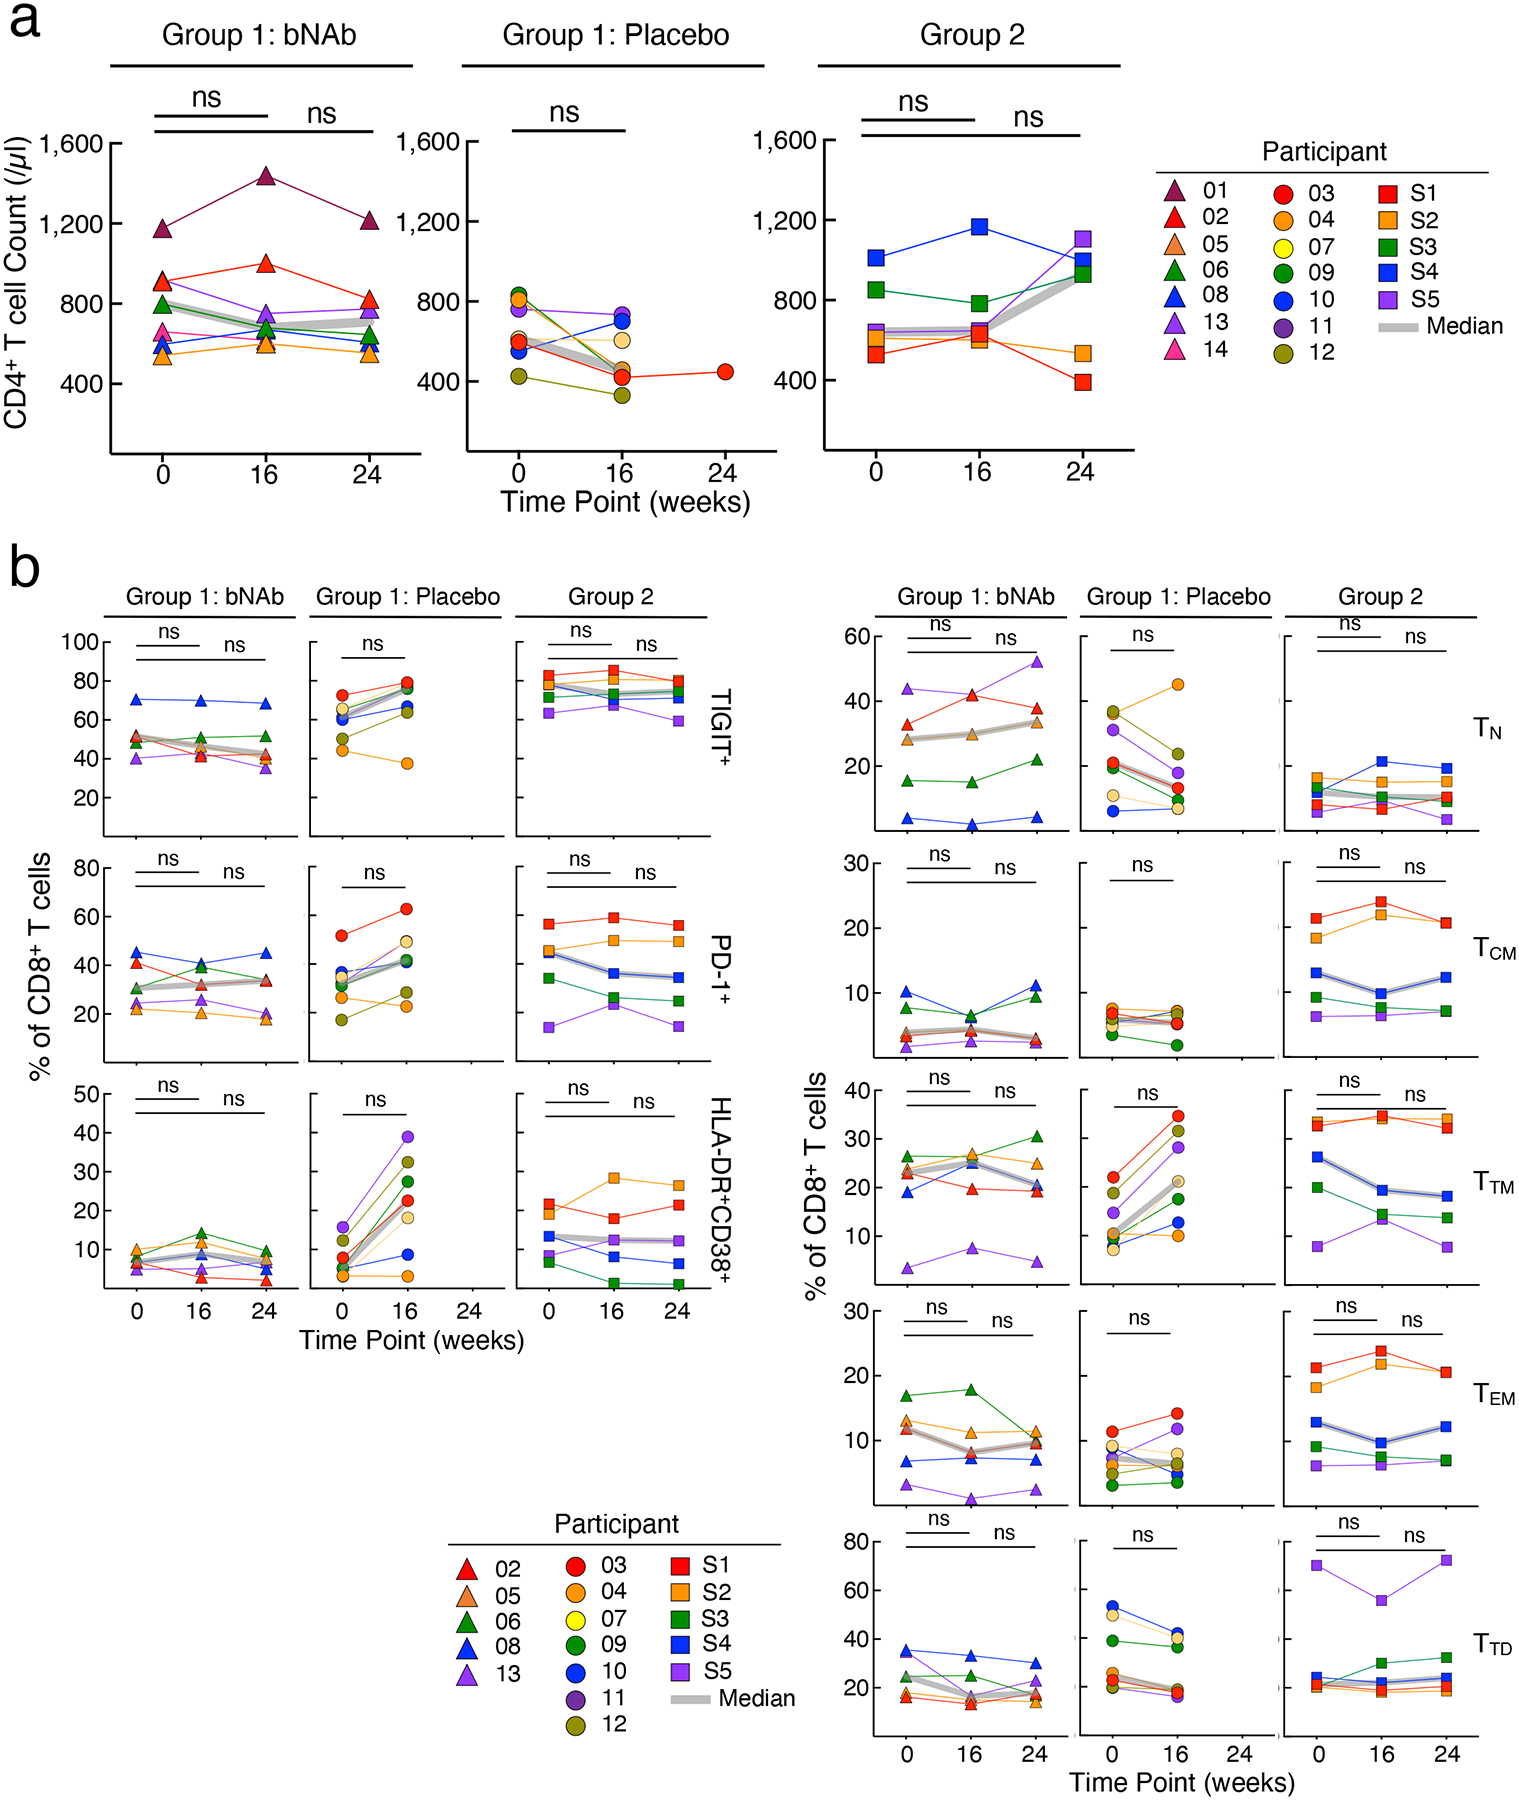
a. Levels of CD4+ T cell counts of the bNAb (n=7) and placebo (n=7) arms of Group 1 and Group 2 (n=5) study participants are shown. b. Frequencies of the activation/exhaustion markers TIGIT, PD-1, CD38 and HLA-DR (left) and T cell subsets (TN, naïve; TCM, central memory; TTM, transitional memory; TEM, effector memory; TTD, terminally differentiated) on CD8+ T cells of the bNAb (n=5) and placebo (n=7) arms of Group 1 and Group 2 (n=5) study participants are shown. The grey lines indicate median values. P values were determined using the two-sided Wilcoxon matched-pairs signed rank test and were adjusted for multiple testing. ns, not significant.
Extended Fig. 4: Phenotypic analysis of T cells.
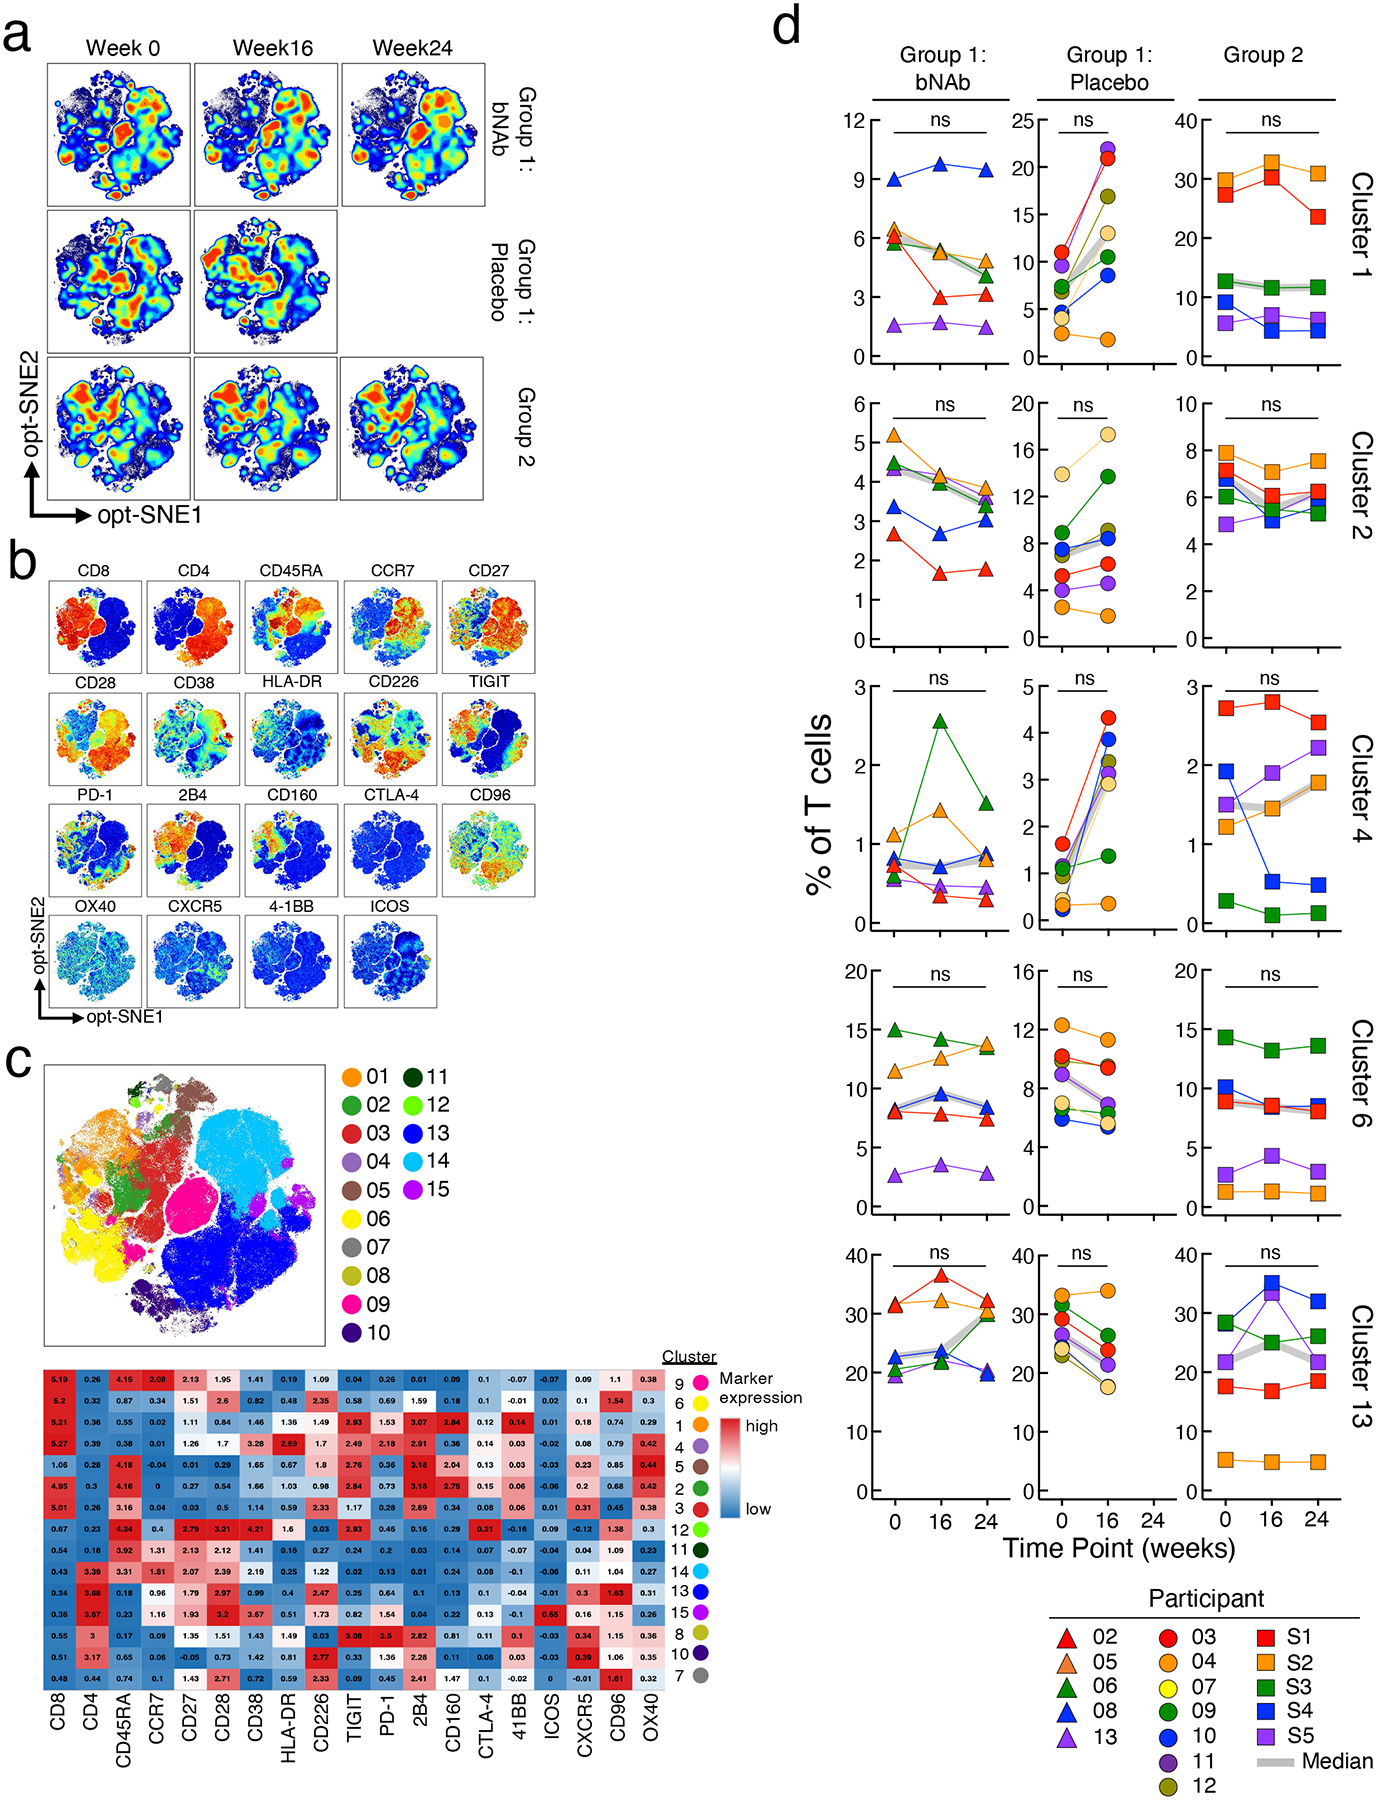
Longitudinal high-dimensional flow cytometric analyses of PBMCs of study participants. a. Global opt-SNE plots of CD3+ T cells of combined data from each group of study participants. b. Opt-SNE visualization of expression of the indicated markers are shown. c. Opt-SNE map of T cell clusters identified by FlowSOM clustering. Each number indicates a distinct cluster. Heatmap shows the level of expression (MFI) within individual clusters. d. Comparison of frequencies of T cells expressing markers associated with indicated clusters in the bNAb (n=5) and placebo (n=7) arms of Group 1 and Group 2 (n=5) study participants are shown. P values were determined using the two-sided Wilcoxon matched-pairs signed rank test and were adjusted for multiple testing. ns, not significant.
Extended Data Fig. 5:
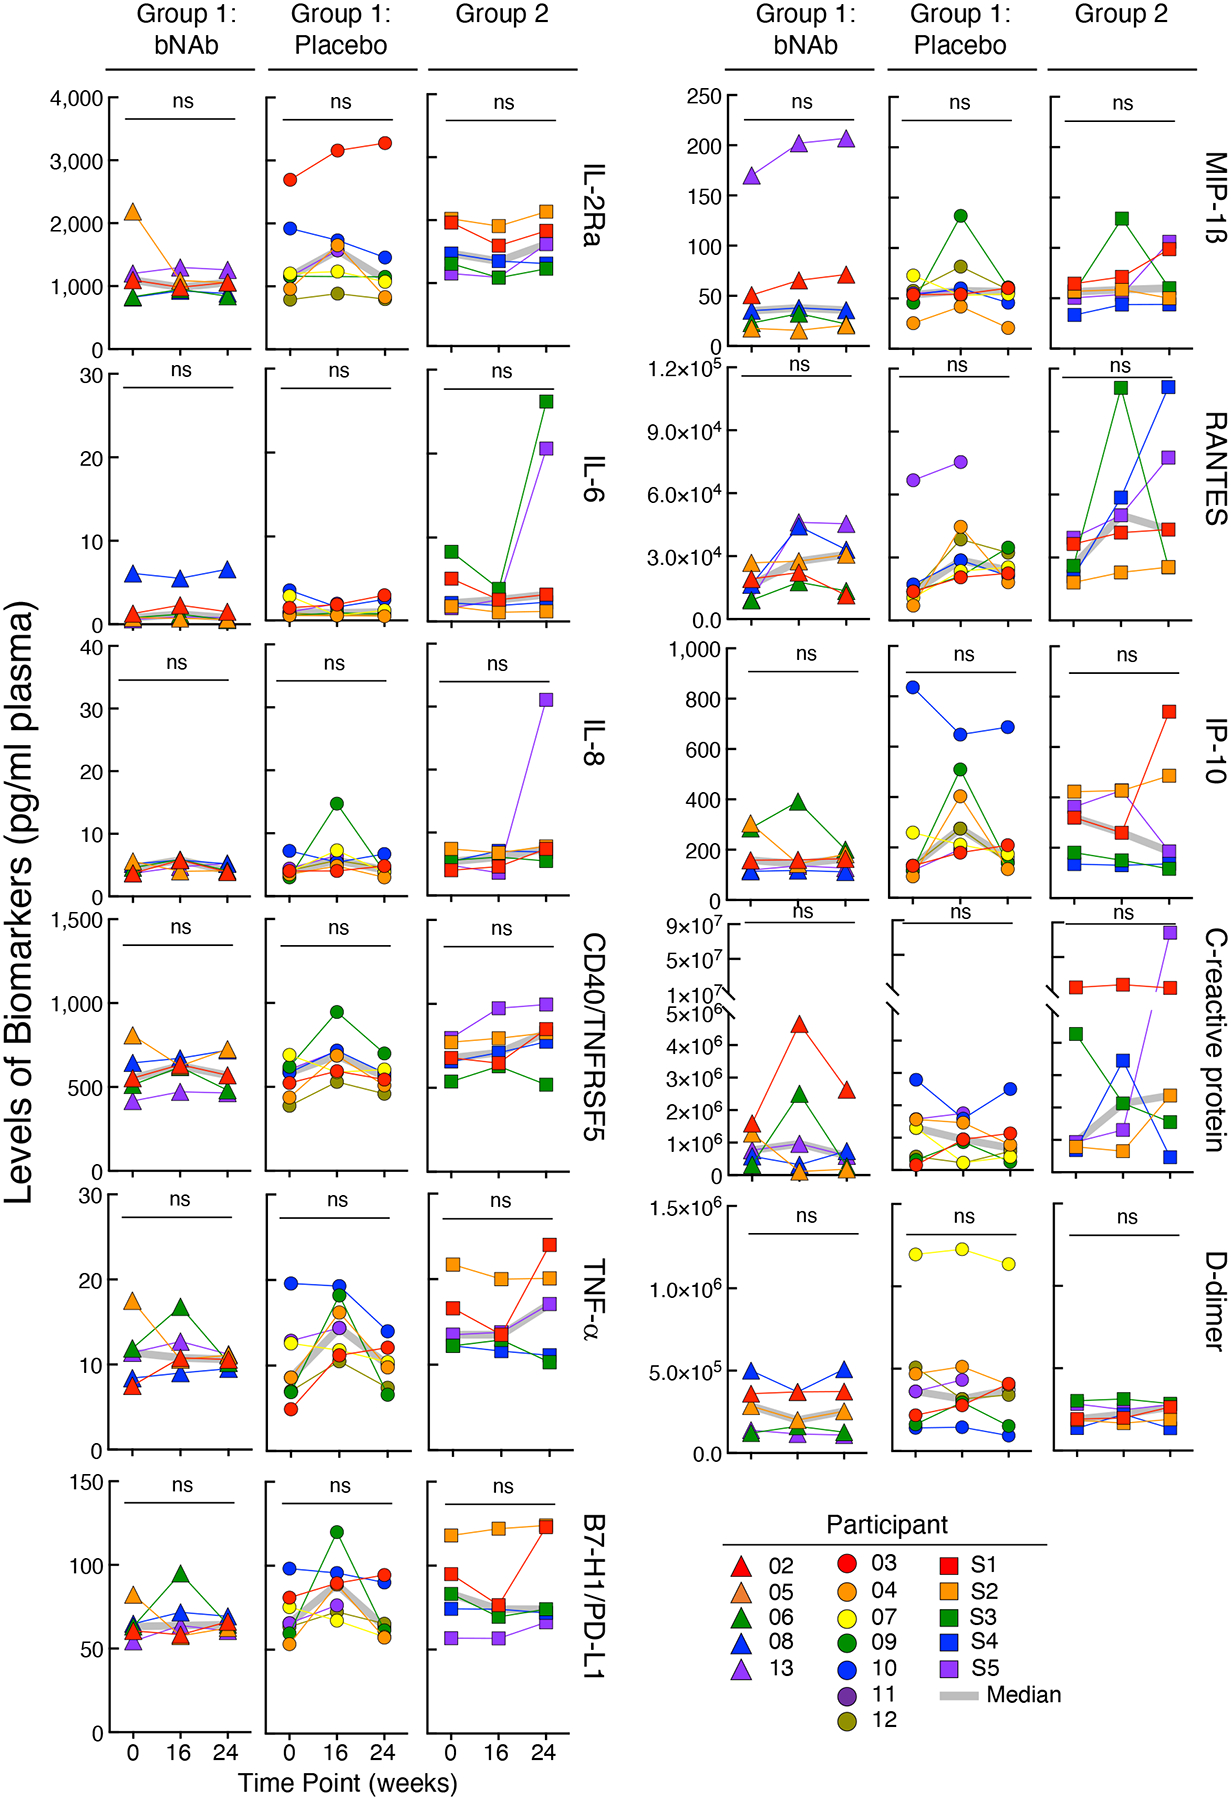
Levels of biomarkers in the plasma of the bNAb (n=5) and placebo (n=7) arms of Group 1 and Group 2 (n=5) study participants over time. The grey lines indicate median values. P values were determined using the two-sided Wilcoxon matched-pairs signed rank test and were adjusted for multiple testing. ns, not significant.
Extended Data Fig. 6: Analysis of HIV-specific CD8+ T cells.
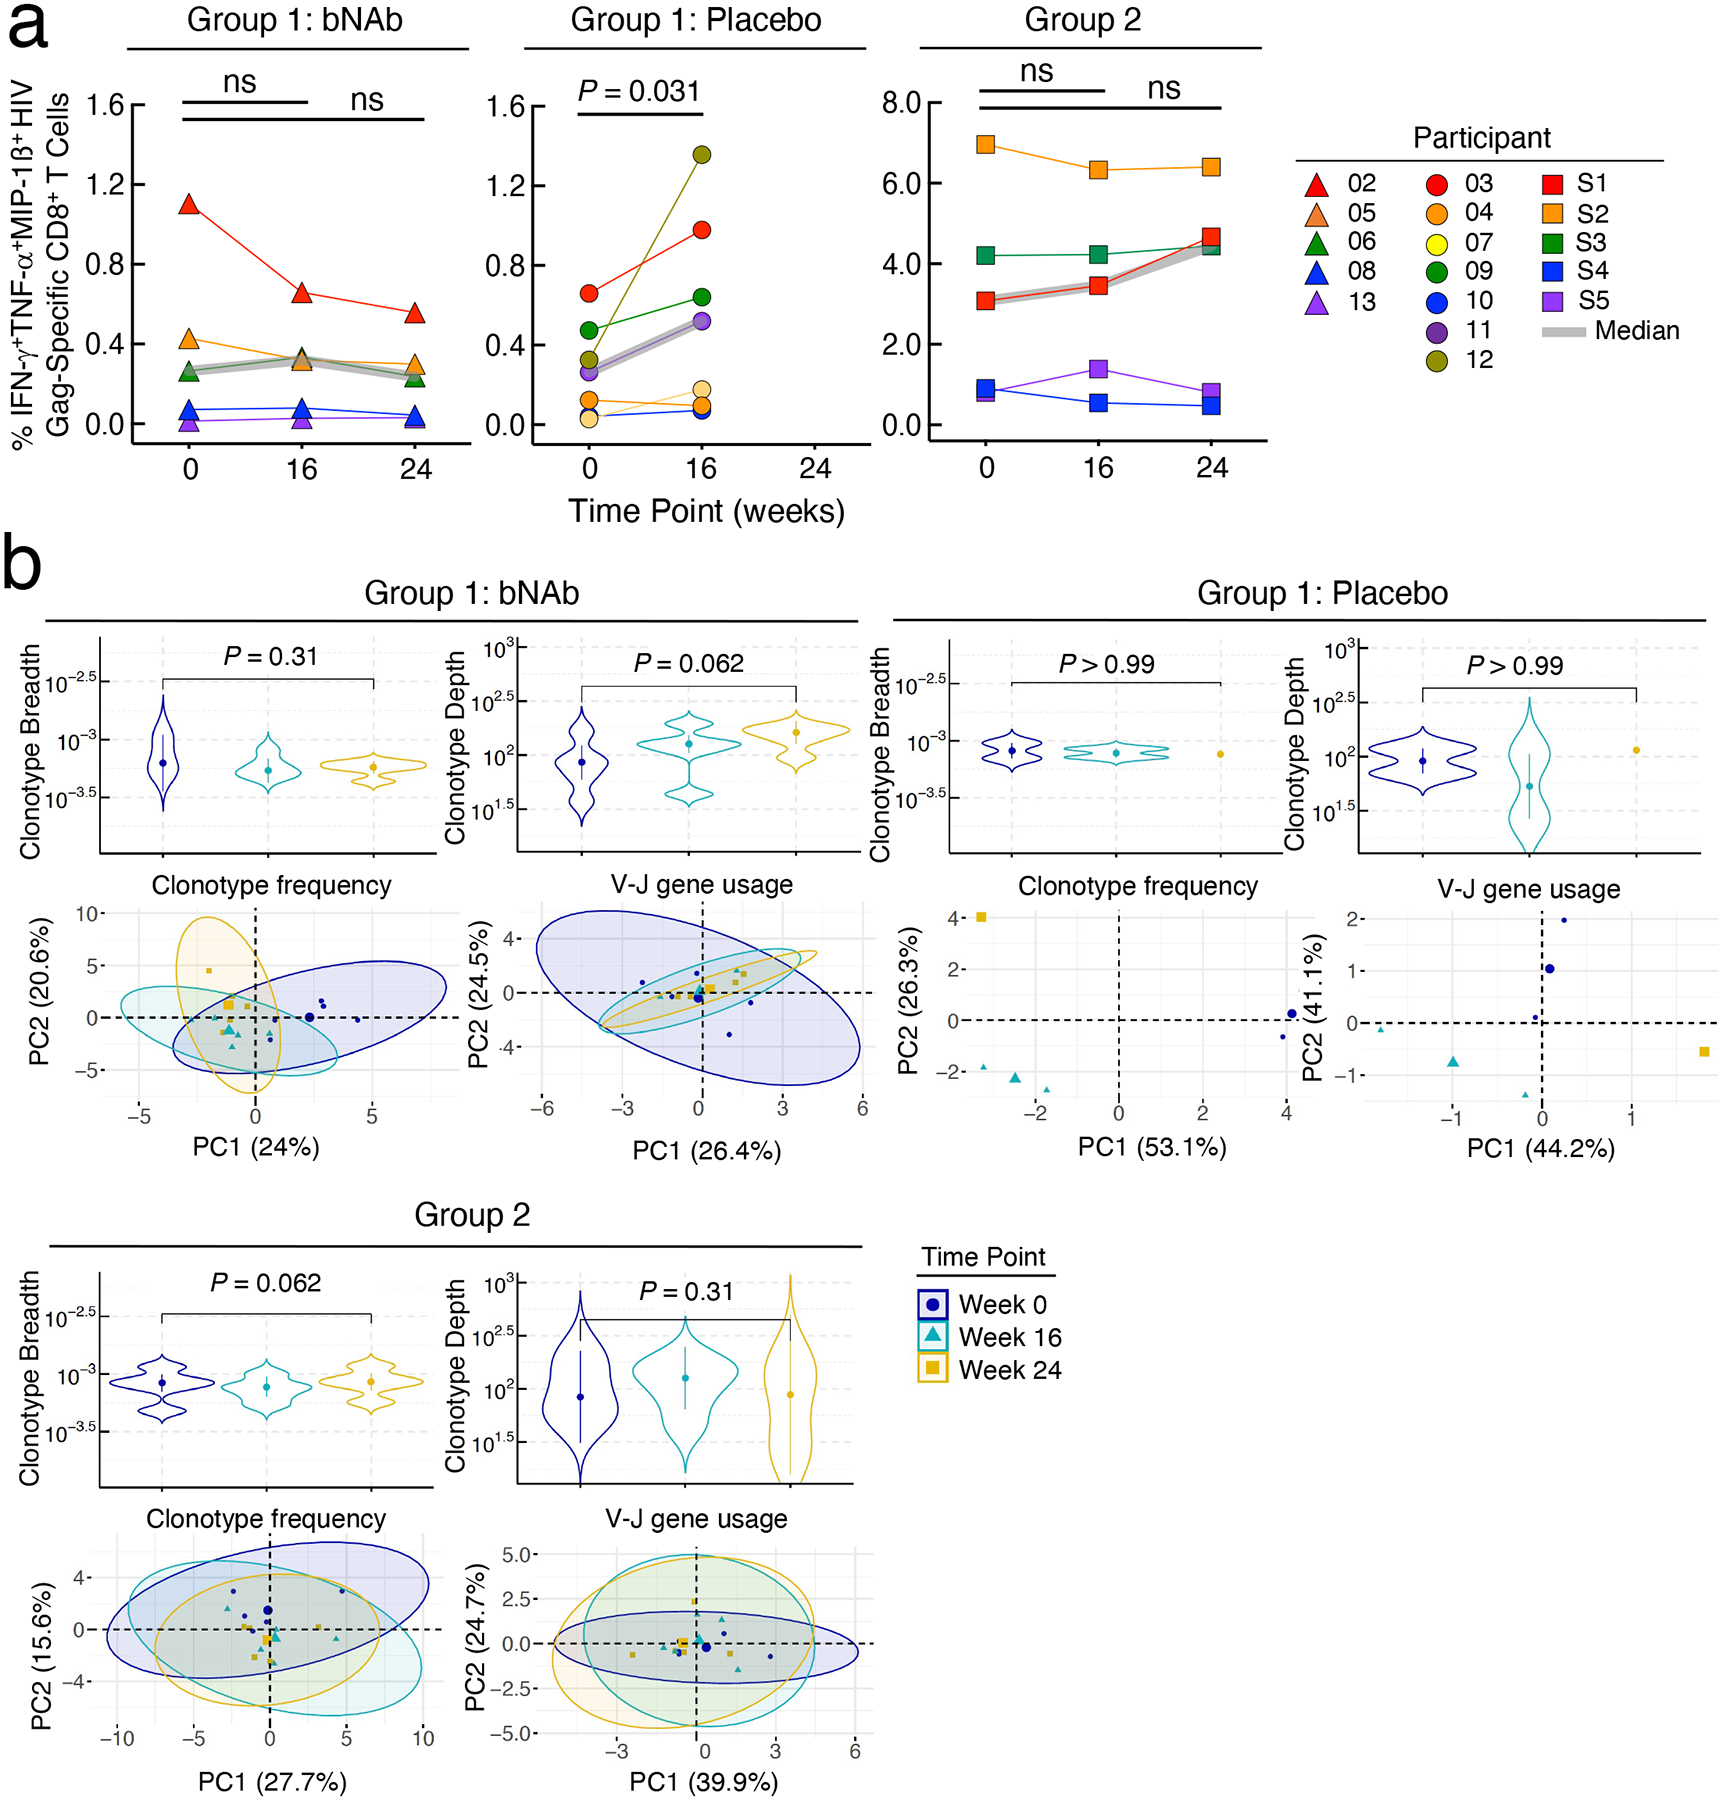
Frequencies of HIV Gag-specific CD8+ T cells and dynamics of CD8+ T cell receptor (TCR) repertoire. a. Frequencies of polyfunctional (IFN-γ+TNF-α+MIP-1ß+) HIV Gag-specific CD8+ T cells in the bNAb (n=5) and placebo (n=7) arms of Group 1 and Group 2 (n=5) study participants are shown. The grey lines indicate median values. P values were determined using the two-sided Wilcoxon matched-pairs signed rank test. b. Changes in the HIV-specific breadth and depth of CD8+ T cells of study participants are shown (upper panels). Highly enriched CD8+ T cells were obtained using a bead-based purification method. The analysis includes 35 CD8+ T cell-derived genomic DNA samples from 12 study participants (15 samples from 5 participants in the bNAb arm of Group 1, 5 samples from 2 participants in the placebo arm of Group 1, and 15 samples from 5 participants in Group 2). Violin plots show the Gaussian kernel probability density of the breadth/depth values over time. The median values and interquartile ranges of the time point-specific distribution are shown as circles and vertical lines, respectively. Principal component analysis (PCA) of the changes in the TCR repertoire characteristics is shown (lower panels). Each ellipse shows the 95% confidence interval in the PCA space and the center of each ellipse is indicated by larger sized symbols that represent specific time points. Lower left panels depict PCA results with the frequencies of the HIV-specific clonotypes ranked among the top 25 with respect to their P values associated with the pairwise comparisons between the three time points. Lower right panels depict PCA results with the gene usage profiles derived from the TRBV-TRBJ gene pairs in the above clonotypes. Principal component (PC) 1 and PC2 represent a lower-dimensional representation of the input data consisting of the frequencies of the HIV-specific clonotypes (lower left panel) and the usage levels of the TRBV-TRBJ gene pairs (lower right panel) for each patient group. P values were determined using the two-sided Wilcoxon signed-rank test.
Supplementary Material
Acknowledgements
We are grateful to the study volunteers for their participation in this study. We thank Drs. David Asmuth, John Mascola, and Sarah Read for their guidance. We are also grateful to the NIAID HIV Outpatient Clinic staff for their assistance in the execution of this study. This work was supported by the Intramural Research Program of the National Institute of Allergy and Infectious Diseases, National Institutes of Health.
Footnotes
Code availability
The R scripts that were used in the data analysis have been deposited at https://github.com/cihangenome/combination-antibodies-HIV. The following is the list of the R packages used (with their version numbers): factoextra_1.0.7, FactoMineR_2.4, reshape_0.8.8, reshape2_1.4.4, writexl_1.4.0, gdata_2.18.0, psych_2.1.9, car_3.0–11, carData_3.0–4, corrr_0.4.3, lubridate_1.8.0, readxl_1.3.1, forcats_0.5.1, stringr_1.4.0, purrr_0.3.4, readr_2.0.2, tidyr_1.1.4, tibble_3.1.5, tidyverse_1.3.1, ggpubr_0.4.0, immunarch_0.6.6, patchwork_1.1.1, data.table_1.14.2 dtplyr_1.1.0, dplyr_1.0.7, and ggplot2_3.3.5.
Competing Interests Statement
There are patents on 3BNC117 (PTC/US2012/038400) and 10–1074 (PTC/US2013/065696) that list M.C.N. as an inventor. 3BNC117 and 10–1074 are licensed to Gilead Sciences by Rockefeller University from which M.C.N. has received payments. M.C.N. is a member of the Scientific Advisory Boards of Celldex Therapeutics, Walking Fish Therapeutics, and Frontier Biotechnologies. M.C.N. had no control over the direction and ultimately the reporting of the clinical portion of the research while holding their financial interests. All other authors declare no competing financial interests.
Data availability
TCR sequencing data are available at https://clients.adaptivebiotech.com/login (login: chun-review@adaptivebiotech.com and password: chun2021review). The HIV-specific CDR3 sequences were downloaded from the following four databases: the immune epitope database (IEDB: http://www.iedb.org/), VDJdb (https://vdjdb.cdr3.net), McPAS-TCR (http://friedmanlab.weizmann.ac.il/McPAS-TCR/), and the Pan immune repertoire database (PIRD: https://db.cngb.org/pird/).
References
- 1.Deeks SG, Lewin SR & Havlir DV The end of AIDS: HIV infection as a chronic disease. Lancet 382, 1525–1533 (2013). [DOI] [PMC free article] [PubMed] [Google Scholar]
- 2.Chun TW, Moir S & Fauci AS HIV reservoirs as obstacles and opportunities for an HIV cure. Nat Immunol 16, 584–589 (2015). [DOI] [PubMed] [Google Scholar]
- 3.Chun TW, Eisinger RW & Fauci AS Durable Control of HIV Infection in the Absence of Antiretroviral Therapy: Opportunities and Obstacles. JAMA 322, 27–28 (2019). [DOI] [PubMed] [Google Scholar]
- 4.Ndung’u T, McCune JM & Deeks SG Why and where an HIV cure is needed and how it might be achieved. Nature 576, 397–405 (2019). [DOI] [PMC free article] [PubMed] [Google Scholar]
- 5.Cohn LB, Chomont N & Deeks SG The Biology of the HIV-1 Latent Reservoir and Implications for Cure Strategies. Cell Host Microbe 27, 519–530 (2020). [DOI] [PMC free article] [PubMed] [Google Scholar]
- 6.Sengupta S & Siliciano RF Targeting the Latent Reservoir for HIV-1. Immunity 48, 872–895 (2018). [DOI] [PMC free article] [PubMed] [Google Scholar]
- 7.Chun TW, et al. Presence of an inducible HIV-1 latent reservoir during highly active antiretroviral therapy. Proc Natl Acad Sci U S A 94, 13193–13197 (1997). [DOI] [PMC free article] [PubMed] [Google Scholar]
- 8.Finzi D, et al. Identification of a reservoir for HIV-1 in patients on highly active antiretroviral therapy. Science 278, 1295–1300 (1997). [DOI] [PubMed] [Google Scholar]
- 9.Wong JK, et al. Recovery of replication-competent HIV despite prolonged suppression of plasma viremia. Science 278, 1291–1295 (1997). [DOI] [PubMed] [Google Scholar]
- 10.Margolis DM, et al. Curing HIV: Seeking to Target and Clear Persistent Infection. Cell 181, 189–206 (2020). [DOI] [PMC free article] [PubMed] [Google Scholar]
- 11.Lewin SR & Rasmussen TA Kick and kill for HIV latency. Lancet 395, 844–846 (2020). [DOI] [PubMed] [Google Scholar]
- 12.Swindells S, et al. Long-Acting Cabotegravir and Rilpivirine for Maintenance of HIV-1 Suppression. N Engl J Med 382, 1112–1123 (2020). [DOI] [PubMed] [Google Scholar]
- 13.Orkin C, et al. Long-Acting Cabotegravir and Rilpivirine after Oral Induction for HIV-1 Infection. N Engl J Med 382, 1124–1135 (2020). [DOI] [PubMed] [Google Scholar]
- 14.Overton ET, et al. Long-acting cabotegravir and rilpivirine dosed every 2 months in adults with HIV-1 infection (ATLAS-2M), 48-week results: a randomised, multicentre, open-label, phase 3b, non-inferiority study. Lancet 396, 1994–2005 (2021). [DOI] [PubMed] [Google Scholar]
- 15.Caskey M, Klein F & Nussenzweig MC Broadly neutralizing anti-HIV-1 monoclonal antibodies in the clinic. Nat Med 25, 547–553 (2019). [DOI] [PMC free article] [PubMed] [Google Scholar]
- 16.Haynes BF, Burton DR & Mascola JR Multiple roles for HIV broadly neutralizing antibodies. Sci Transl Med 11, eaaz2686 (2019). [DOI] [PMC free article] [PubMed] [Google Scholar]
- 17.Gama L & Koup RA New-Generation High-Potency and Designer Antibodies: Role in HIV-1 Treatment. Annu Rev Med 69, 409–419 (2018). [DOI] [PubMed] [Google Scholar]
- 18.Nishimura Y & Martin MA Of Mice, Macaques, and Men: Broadly Neutralizing Antibody Immunotherapy for HIV-1. Cell Host Microbe 22, 207–216 (2017). [DOI] [PMC free article] [PubMed] [Google Scholar]
- 19.Bar KJ, et al. Effect of HIV Antibody VRC01 on Viral Rebound after Treatment Interruption. N Engl J Med 375, 2037–2050 (2016). [DOI] [PMC free article] [PubMed] [Google Scholar]
- 20.Caskey M, et al. Viraemia suppressed in HIV-1-infected humans by broadly neutralizing antibody 3BNC117. Nature 522, 487–491 (2015). [DOI] [PMC free article] [PubMed] [Google Scholar]
- 21.Caskey M, et al. Antibody 10–1074 suppresses viremia in HIV-1-infected individuals. Nat Med 23, 185–191 (2017). [DOI] [PMC free article] [PubMed] [Google Scholar]
- 22.Scheid JF, et al. HIV-1 antibody 3BNC117 suppresses viral rebound in humans during treatment interruption. Nature 535, 556–560 (2016). [DOI] [PMC free article] [PubMed] [Google Scholar]
- 23.Mendoza P, et al. Combination therapy with anti-HIV-1 antibodies maintains viral suppression. Nature 561, 479–484 (2018). [DOI] [PMC free article] [PubMed] [Google Scholar]
- 24.Nishimura Y, et al. Early antibody therapy can induce long-lasting immunity to SHIV. Nature 543, 559–563 (2017). [DOI] [PMC free article] [PubMed] [Google Scholar]
- 25.Lu CL, et al. Enhanced clearance of HIV-1-infected cells by broadly neutralizing antibodies against HIV-1 in vivo. Science 352, 1001–1004 (2016). [DOI] [PMC free article] [PubMed] [Google Scholar]
- 26.Schoofs T, et al. HIV-1 therapy with monoclonal antibody 3BNC117 elicits host immune responses against HIV-1. Science 352, 997–1001 (2016). [DOI] [PMC free article] [PubMed] [Google Scholar]
- 27.Niessl J, et al. Combination anti-HIV-1 antibody therapy is associated with increased virus-specific T cell immunity. Nat Med 26, 222–227 (2020). [DOI] [PMC free article] [PubMed] [Google Scholar]
- 28.Sneller MC, et al. A randomized controlled safety/efficacy trial of therapeutic vaccination in HIV-infected individuals who initiated antiretroviral therapy early in infection. Sci Transl Med 9, eaan8848 (2017). [DOI] [PMC free article] [PubMed] [Google Scholar]
- 29.Deeks SG HIV infection, inflammation, immunosenescence, and aging. Annu Rev Med 62, 141–155 (2011). [DOI] [PMC free article] [PubMed] [Google Scholar]
- 30.Van Gassen S, et al. FlowSOM: Using self-organizing maps for visualization and interpretation of cytometry data. Cytometry A 87, 636–645 (2015). [DOI] [PubMed] [Google Scholar]
- 31.Nishimura Y, et al. Immunotherapy during the acute SHIV infection of macaques confers long-term suppression of viremia. J Exp Med 218(2021). [DOI] [PMC free article] [PubMed] [Google Scholar]
- 32.Barouch DH & Deeks SG Immunologic strategies for HIV-1 remission and eradication. Science 345, 169–174 (2014). [DOI] [PMC free article] [PubMed] [Google Scholar]
- 33.Collins DR, Gaiha GD & Walker BD CD8(+) T cells in HIV control, cure and prevention. Nat Rev Immunol 20, 471–482 (2020). [DOI] [PMC free article] [PubMed] [Google Scholar]
- 34.Kwong PD & Mascola JR HIV-1 Vaccines Based on Antibody Identification, B Cell Ontogeny, and Epitope Structure. Immunity 48, 855–871 (2018). [DOI] [PubMed] [Google Scholar]
- 35.Sok D & Burton DR Recent progress in broadly neutralizing antibodies to HIV. Nat Immunol 19, 1179–1188 (2018). [DOI] [PMC free article] [PubMed] [Google Scholar]
- 36.Collins DR, et al. Functional impairment of HIV-specific CD8(+) T cells precedes aborted spontaneous control of viremia. Immunity 54, 2372–2384 e2377 (2021). [DOI] [PMC free article] [PubMed] [Google Scholar]
- 37.Migueles SA & Connors M Success and failure of the cellular immune response against HIV-1. Nat Immunol 16, 563–570 (2015). [DOI] [PubMed] [Google Scholar]
- 38.Sarzotti-Kelsoe M, et al. Optimization and validation of the TZM-bl assay for standardized assessments of neutralizing antibodies against HIV-1. J Immunol Methods 409, 131–146 (2014). [DOI] [PMC free article] [PubMed] [Google Scholar]
- 39.Clarridge KE, et al. Effect of analytical treatment interruption and reinitiation of antiretroviral therapy on HIV reservoirs and immunologic parameters in infected individuals. PLoS Pathog 14, e1006792 (2018). [DOI] [PMC free article] [PubMed] [Google Scholar]
- 40.Bruner KM, et al. A quantitative approach for measuring the reservoir of latent HIV-1 proviruses. Nature 566, 120–125 (2019). [DOI] [PMC free article] [PubMed] [Google Scholar]
- 41.Myers LE, McQuay LJ & Hollinger FB Dilution assay statistics. J Clin Microbiol 32, 732–739 (1994). [DOI] [PMC free article] [PubMed] [Google Scholar]
- 42.Robins HS, et al. Comprehensive assessment of T-cell receptor β-chain diversity in αβ T cells. Blood, The Journal of the American Society of Hematology 114, 4099–4107 (2009). [DOI] [PMC free article] [PubMed] [Google Scholar]
- 43.Carlson CS, et al. Using synthetic templates to design an unbiased multiplex PCR assay. Nat Commun 4, 2680 (2013). [DOI] [PubMed] [Google Scholar]
- 44.Snyder TM, et al. Magnitude and dynamics of the T-cell response to SARS-CoV-2 infection at both individual and population levels. MedRxiv (2020). [Google Scholar]
- 45.Team I immunarch: An R Package for Painless Bioinformatics Analysis of T-Cell and B-Cell Immune Repertoires. Nairobi: Zenodo; 10(2019). [Google Scholar]
- 46.Vita R, et al. The immune epitope database (IEDB): 2018 update. Nucleic acids research 47, D339–D343 (2019). [DOI] [PMC free article] [PubMed] [Google Scholar]
- 47.Shugay M, et al. VDJdb: a curated database of T-cell receptor sequences with known antigen specificity. Nucleic acids research 46, D419–D427 (2018). [DOI] [PMC free article] [PubMed] [Google Scholar]
- 48.Tickotsky N, Sagiv T, Prilusky J, Shifrut E & Friedman N McPAS-TCR: a manually curated catalogue of pathology-associated T cell receptor sequences. Bioinformatics 33, 2924–2929 (2017). [DOI] [PubMed] [Google Scholar]
- 49.Zhang W, et al. PIRD: Pan immune repertoire database. Bioinformatics 36, 897–903 (2020). [DOI] [PubMed] [Google Scholar]
- 50.Kassambara A ggpubr:“ggplot2” based publication ready plots. R package version 0.1 7 (2018). [Google Scholar]
- 51.Lê S, Josse J & Husson F FactoMineR : an R package for multivariate analysis. Journal of statistical software 25, 1–18 (2008). [Google Scholar]
Associated Data
This section collects any data citations, data availability statements, or supplementary materials included in this article.
Supplementary Materials
Data Availability Statement
TCR sequencing data are available at https://clients.adaptivebiotech.com/login (login: chun-review@adaptivebiotech.com and password: chun2021review). The HIV-specific CDR3 sequences were downloaded from the following four databases: the immune epitope database (IEDB: http://www.iedb.org/), VDJdb (https://vdjdb.cdr3.net), McPAS-TCR (http://friedmanlab.weizmann.ac.il/McPAS-TCR/), and the Pan immune repertoire database (PIRD: https://db.cngb.org/pird/).


