
Extended Data Fig. 6: Analysis of HIV-specific CD8+ T cells.
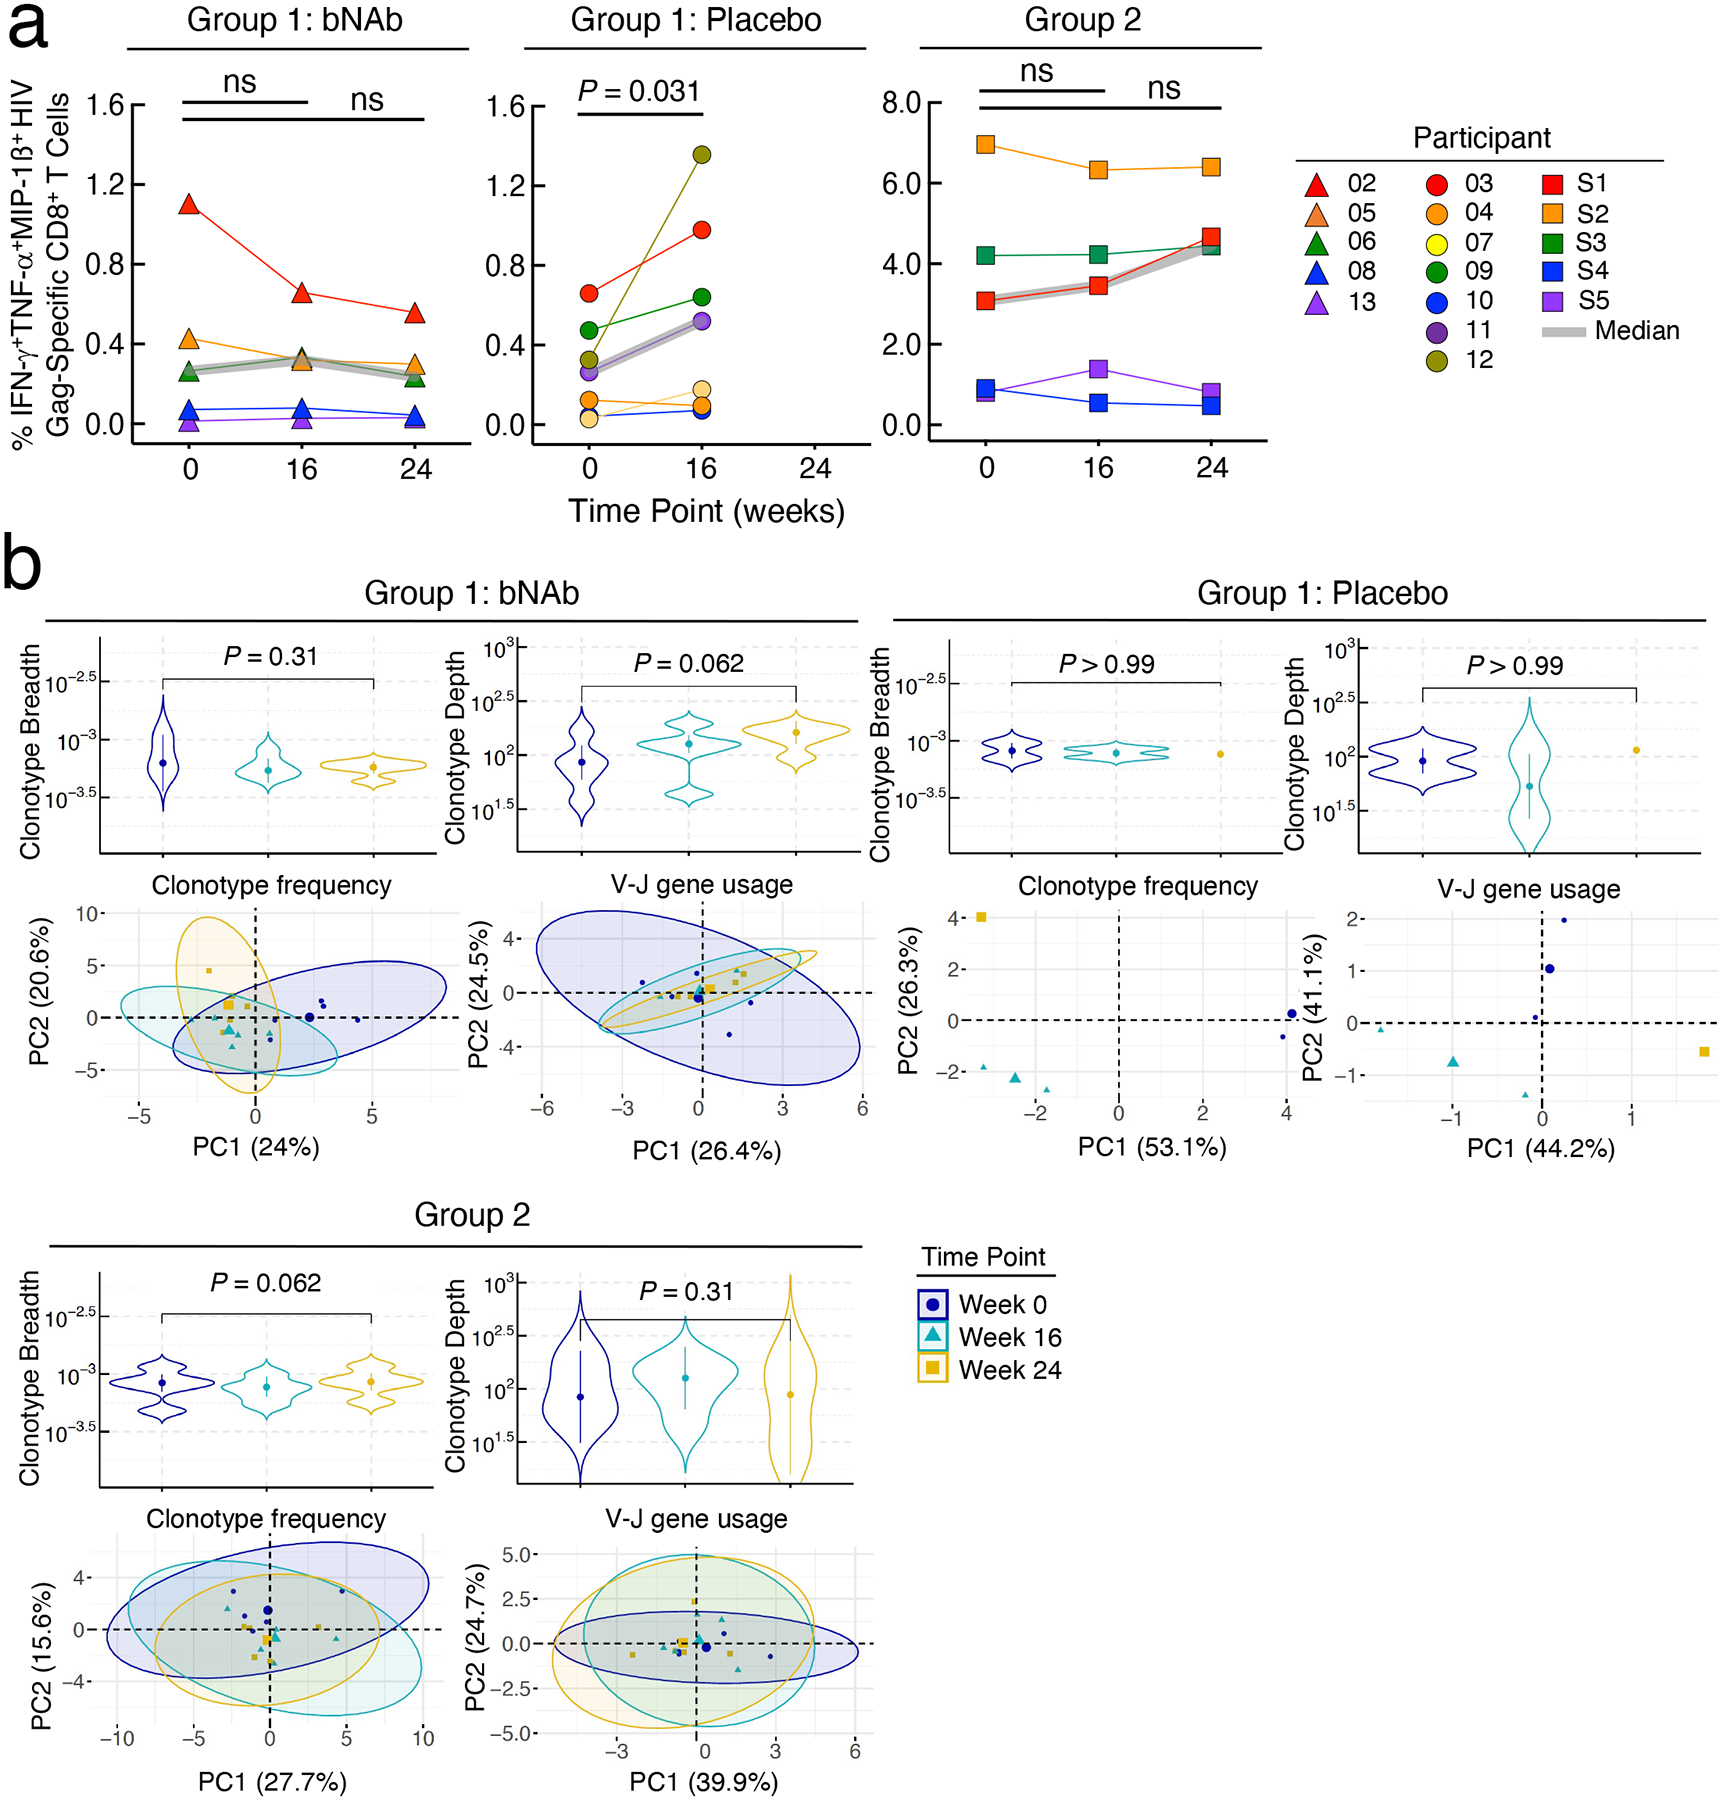
Frequencies of HIV Gag-specific CD8+ T cells and dynamics of CD8+ T cell receptor (TCR) repertoire. a. Frequencies of polyfunctional (IFN-γ+TNF-α+MIP-1ß+) HIV Gag-specific CD8+ T cells in the bNAb (n=5) and placebo (n=7) arms of Group 1 and Group 2 (n=5) study participants are shown. The grey lines indicate median values. P values were determined using the two-sided Wilcoxon matched-pairs signed rank test. b. Changes in the HIV-specific breadth and depth of CD8+ T cells of study participants are shown (upper panels). Highly enriched CD8+ T cells were obtained using a bead-based purification method. The analysis includes 35 CD8+ T cell-derived genomic DNA samples from 12 study participants (15 samples from 5 participants in the bNAb arm of Group 1, 5 samples from 2 participants in the placebo arm of Group 1, and 15 samples from 5 participants in Group 2). Violin plots show the Gaussian kernel probability density of the breadth/depth values over time. The median values and interquartile ranges of the time point-specific distribution are shown as circles and vertical lines, respectively. Principal component analysis (PCA) of the changes in the TCR repertoire characteristics is shown (lower panels). Each ellipse shows the 95% confidence interval in the PCA space and the center of each ellipse is indicated by larger sized symbols that represent specific time points. Lower left panels depict PCA results with the frequencies of the HIV-specific clonotypes ranked among the top 25 with respect to their P values associated with the pairwise comparisons between the three time points. Lower right panels depict PCA results with the gene usage profiles derived from the TRBV-TRBJ gene pairs in the above clonotypes. Principal component (PC) 1 and PC2 represent a lower-dimensional representation of the input data consisting of the frequencies of the HIV-specific clonotypes (lower left panel) and the usage levels of the TRBV-TRBJ gene pairs (lower right panel) for each patient group. P values were determined using the two-sided Wilcoxon signed-rank test.