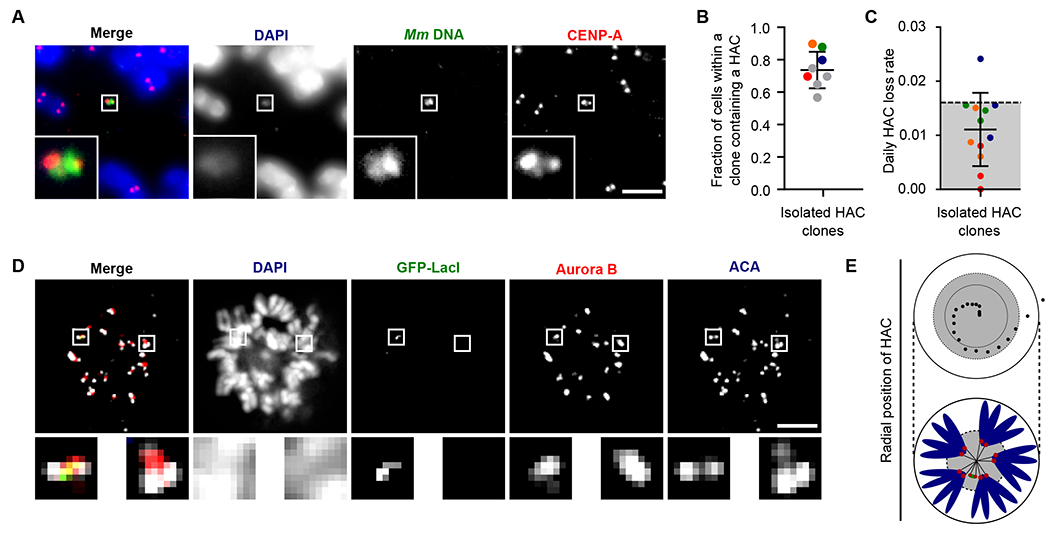
Fig. 2. YAC-Mm-4q21LacO-based HACs are inherited as autonomous chromosomes with functional kinetochores and robust CPC recruitment.

(A) Representative image of a single copy HAC that has been isolated in a monoclonal cell line. Inset: 5x magnification. Bar, 5 μm. (B) Quantification of fraction of spreads with a HAC in monoclonal cell lines. The mean (+/− SD) is shown. Colors indicate individual HAC lines that were assessed in HAC retention assays. Red, orange, green and blue correspond to HAC clones 1, 2, 3, and 5. (C) Quantification of HAC loss rate after culturing without selection for 30 days. The mean (+/−SD) is shown. Experiments are color coded to correspond to the clones shown in panel B. Grey shading indicates the range of loss rates for prior generations of HACs (12, 16, 29). (D) Representative image of HACs synchronized in mitosis showing Aurora B and ACA. The image shows 8 0.2 μm z-projected stacks (see also Fig. S4 for centromere delineation in the z-dimension). Inset: 5x magnification. Bar, 5 μm. (E) The radial position of HACs was measured relative to endogenous centromeres. The position of 20 HACs, each endogenous centromere and the center of DNA mass was measured. The distance between HAC or endogenous centromere and the center of DNA mass was calculated. The distance of each HAC from the center was normalized based on the total length across (i.e. the diameter) of mitotic chromosomes. The inner black circle represents the mean radial position of endogenous centromeres, while the dotted line represents one standard deviation from the mean. An illustration is shown below the graph.
