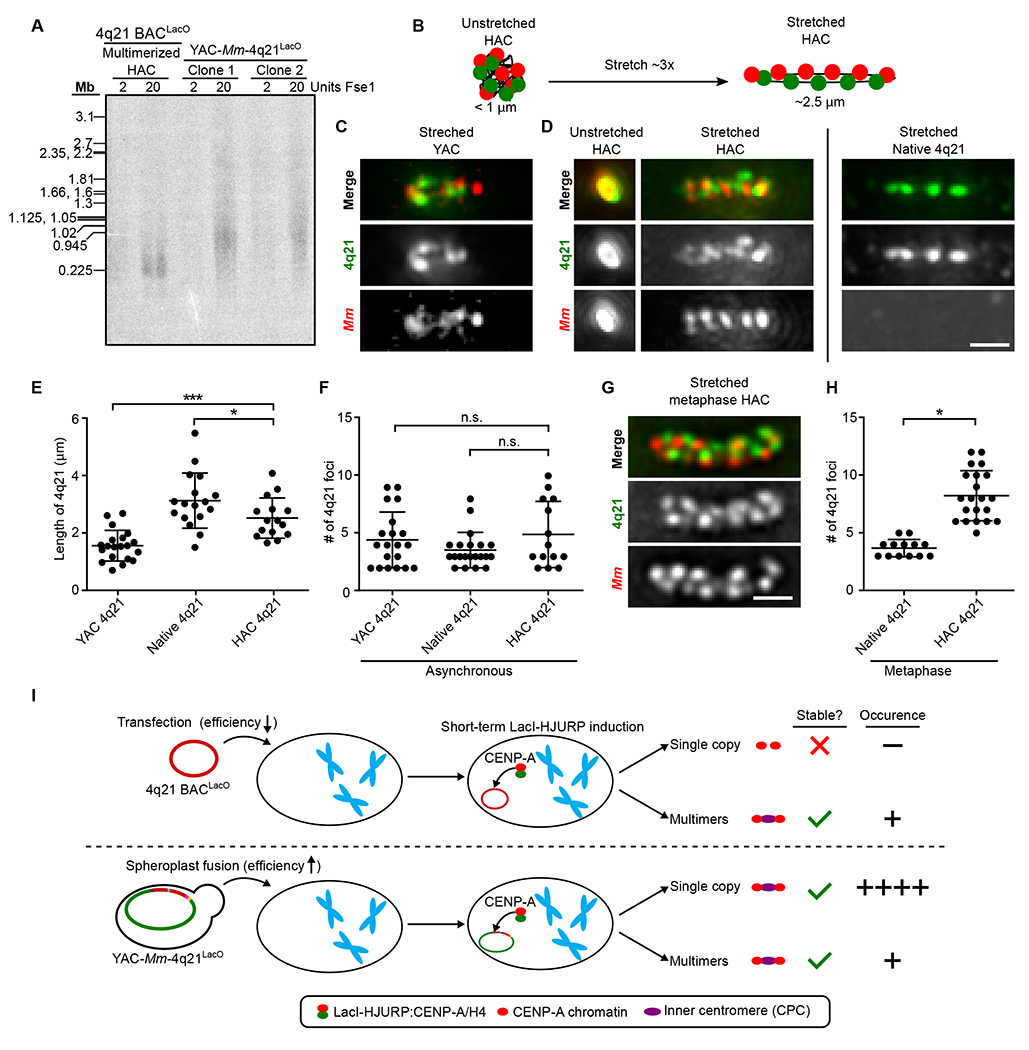
Fig. 4. YAC-Mm-4q21LacO-based HACs are intact 760 kb circles with similar chromatin stretching properties as natural chromosomes.

(A) Southern bot analysis of the indicated HAC lines using a LacO probe. The multimerized HAC line was diluted 20-fold in HT1080 cells to reduce signal relative to the YAC-Mm-4q21LacO-based HAC so that they could be in a similar range of detection. (B) Schematic showing extent of stretching HACs in our experiments (panels D-H), with indicated regions detected by FISH. The number of foci shown is in the range predicted by prior stretching experiments with natural chromosomes, with actual outcomes measured in panels C-G and fig. S6. (C) Representative images of a stretched YAC with both the 4q21 and M. mycoides sequence labeled via FISH compared to endogenous 4q21 in asynchronous cells. Bar, 1 μm. (D) Representative images of an unstretched and stretched HAC with both the 4q21 and M. mycoides sequence labeled via FISH compared to endogenous 4q21 in asynchronous cells. Bar, 1 μm. (E) Quantification of the length of 4q21 FISH in the YAC, HAC and the endogenous chromosome after stretching chromatin in asynchronous cells. The mean (+/− SD) is shown. p< 0.001 and p < 0.05 based on an unpaired, two-tailed t-test. (F) Quantification of the number of foci from 4q21 FISH in the YAC, HAC and in the endogenous chromosome after stretching chromatin in asynchronous cells. The mean (+/− SD) is shown. p values > 0.05 based on an unpaired, two-tailed t-test and is marked as not significant (n.s.). (G) Representative images of a stretched HAC with both the 4q21 and M. mycoides sequence labeled via FISH after enriching for cells in metaphase. Bar, 1 μm. (H) Quantification of the number of foci from 4q21 FISH in the HAC and the endogenous chromosome after stretching chromatin and enriching for cells in metaphase. The mean (+/− SD) is shown. p < 0.0001 based on an unpaired, two-tailed t-test. (I) Model illustrating how construct size influences HAC formation outcomes. Single-copy BAC-based HACs have never been isolated and are shown as too small to harbor a functional inner centromere.
