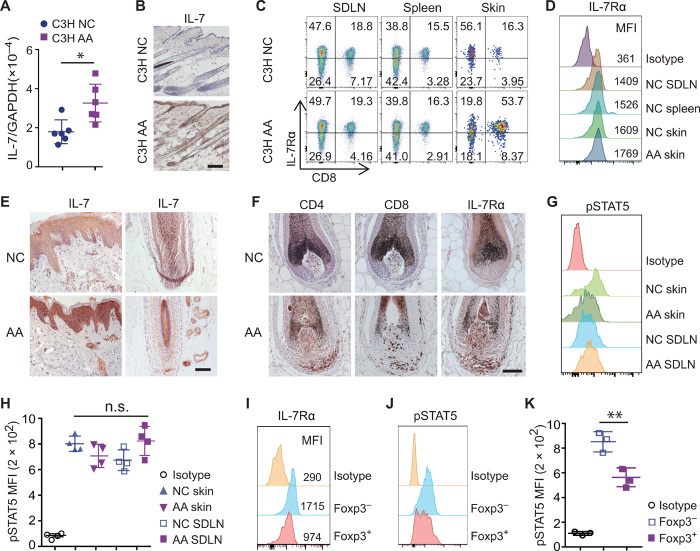
Fig. 1. Increased IL-7 in AA lesional skin.
(A) Quantitative reverse transcription polymerase chain reaction measuring transcript levels of IL-7 in skin of C3H/HeJ mice with or without AA. *P < 0.05 (unpaired Student’s t test). GAPDH, glyceraldehyde-3-phosphate dehydrogenase. (B) Representative immunohistochemical analyses of IL-7 protein expression in C3H/HeJ mice with or without AA. Scale bars, 100 μm. Data represented from three C3H AA and three C3H NC controls. (C and D) Representative flow cytometric analysis of IL-7Rα expression on CD8+ T cells by gating CD45+ cells within SDLN, spleen, or skin from C3H mice with or without AA. MFI, mean fluorescence intensity. (E and F) Representative immunohistochemical analyses of human scalp sections of AA and normal controls showing IL-7 (E) and IL-7Rα protein expression (F). Data represented from three AA and four NC controls. Scale bars, 100 μm. (G and H) pSTAT5 expression in CD8+ T cells after treatment with IL-7. (G) Representative histograms. (H) Summary graphs of MFI. n.s., not significant [one-way analysis of variance (ANOVA)]. (I) IL-7Rα expression by CD4+Foxp3− T cells and CD4+Foxp3+ Tregs within SDLN from C3H NC mice. (J and K) pSTAT5 expression in CD4+Foxp3− T cells and Tregs after treatment with IL-7. (J) Representative histograms. (K) Summary graphs of MFI. **P < 0.05 (one-way ANOVA).

