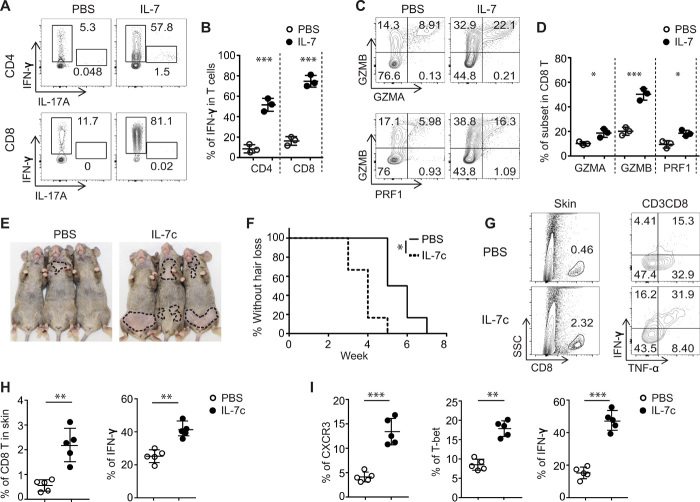
Fig. 2. IL-7 promoted the development of Tc1 cells and accelerated the development of AA.
(A to D) Purified naïve CD4+ and CD8+ T cells were stimulated in the presence of IL-7 (10 ng/ml) for 4 days. (A and B) Representative flow cytometric plots and summary graphs of IFN-γ–producing T cells. (C and D) Representative flow cytometric plots and summary graphs of GZMA, GZMB, or PRF1–producing CD8+ T cells. Data are represented as the means ± SD of three independent experiments. *P < 0.05 and ***P < 0.001 (unpaired Student’s t test). (E and F) C3H skin-grafted mice were given IL-7c (0.5-μg IL-7 mixed with 5-μg anti–IL-7 mAb M25, 37°C for 20 min) once a week for 2 weeks after 2 weeks after skin grafting. Representative images (E) and the incidence of AA onset (F) in grafted C3H/HeJ mice treated with IL-7c (n = 6) or PBS (n = 6). *P < 0.05, log-rank test. (G and H) Representative fluorescence-activated cell sorting plots and summary graphs of the percentages of T cell profiles in the skin of grafted mice treated with IL-7c or PBS. Data are represented as the means ± SD of two independent experiments. **P < 0.01 (unpaired Student’s t test). (I) Summary graphs of the percentages of CD8+ T cell subsets within SDLNs. Data are represented as the means ± SD of two independent experiments. **P < 0.01 and ***P < 0.001 (unpaired Student’s t test). Photo credit: Mice pictures taken by Zhenpeng Dai, Columbia University.

