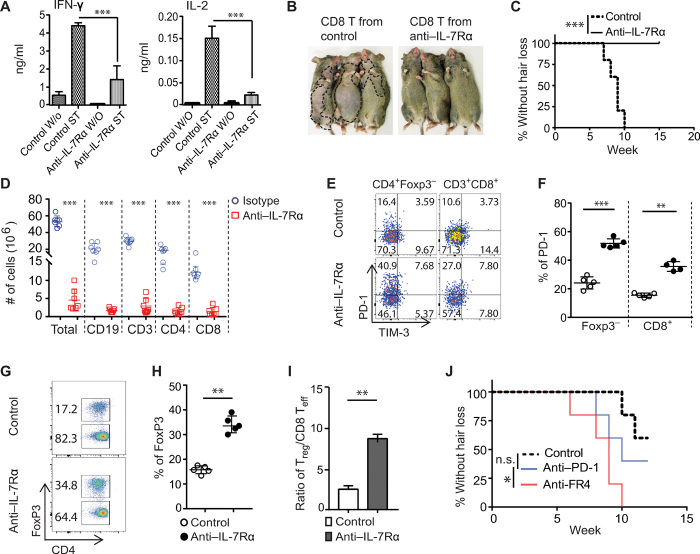
Fig. 5. IL-7Rα blockade inhibited effector T cells but spared Tregs in C3H/HeJ mice.
(A to C) C3H/HeJ AA mice were treated as in Fig. 4. (A) Cytokines production by purified SDLN T cells after stimulation for 48 hours. ST (stimulation with anti-CD3/CD28), W/O (without stimulation). ***P < 0.001 (one-way ANOVA). (B and C) Normal C3H/HeJ mice (n = 6) were transferred with 10 × 106 activated CD8+ T cells (either from anti–IL-7Rα or control mAb–treated mice). Representative images (B) and the incidence of AA (C). ***P < 0.001 (log-rank test). (D to I) The animals were treated as in Fig. 4. (D) The total numbers of immune cell subsets within SDLNs of the anti–IL-7Rα or control mAb–treated mice. (E to F) Representative flow cytometric plots and summary graphs of the percentages of PD-1+ T cells within indicated T cell populations. (G to H) Representative flow cytometric plots and summary graphs of the percentages of Tregs within total CD4+ T populations. (I) Bar diagram depicts the ratio of Tregs:CD8+ T effectors within SDLNs from the two groups. Data are represented as the means ± SD of two independent experiments. **P < 0.01 (unpaired Student’s t test). (J) The incidence of AA onset in C3H/HeJ mice were treated with anti–IL-7Rα mAb following treatment with anti–PD-1 mAb (n = 10), Treg depletion (n = 10), or control mAb (n = 10). ns, not significant; *P < 0.05, log-rank test. Photo credit: Mice pictures taken by Zhenpeng Dai, Columbia University.

