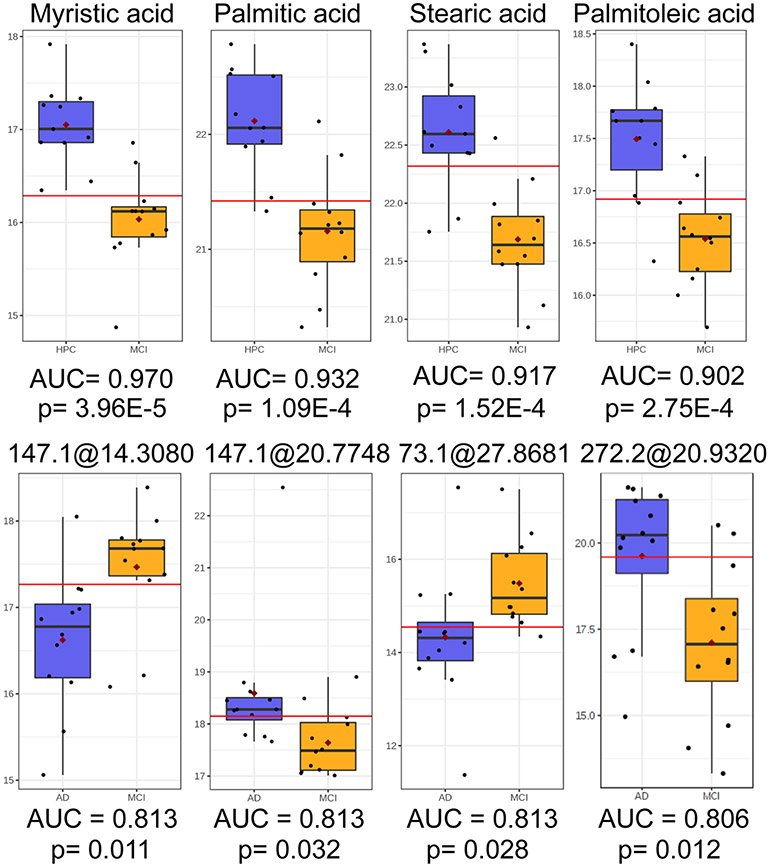
Figure 4.
Top row: Relative abundances of myristic acid, palmitic acid, stearic acid, and palmitoleic acid with high predictive accuracy (AUC > 0.90) and significance (FDR q < 0.05) in univariate ROC analysis and t-testing between HPC and MCI groups. Bottom row: Relative abundances of four unidentified features from untargeted GC–MS analysis with good predictive accuracy (AUC > 0.80) and significance (FDR q < 0.05) in univariate ROC analysis and t-testing between MCI and AD groups.

