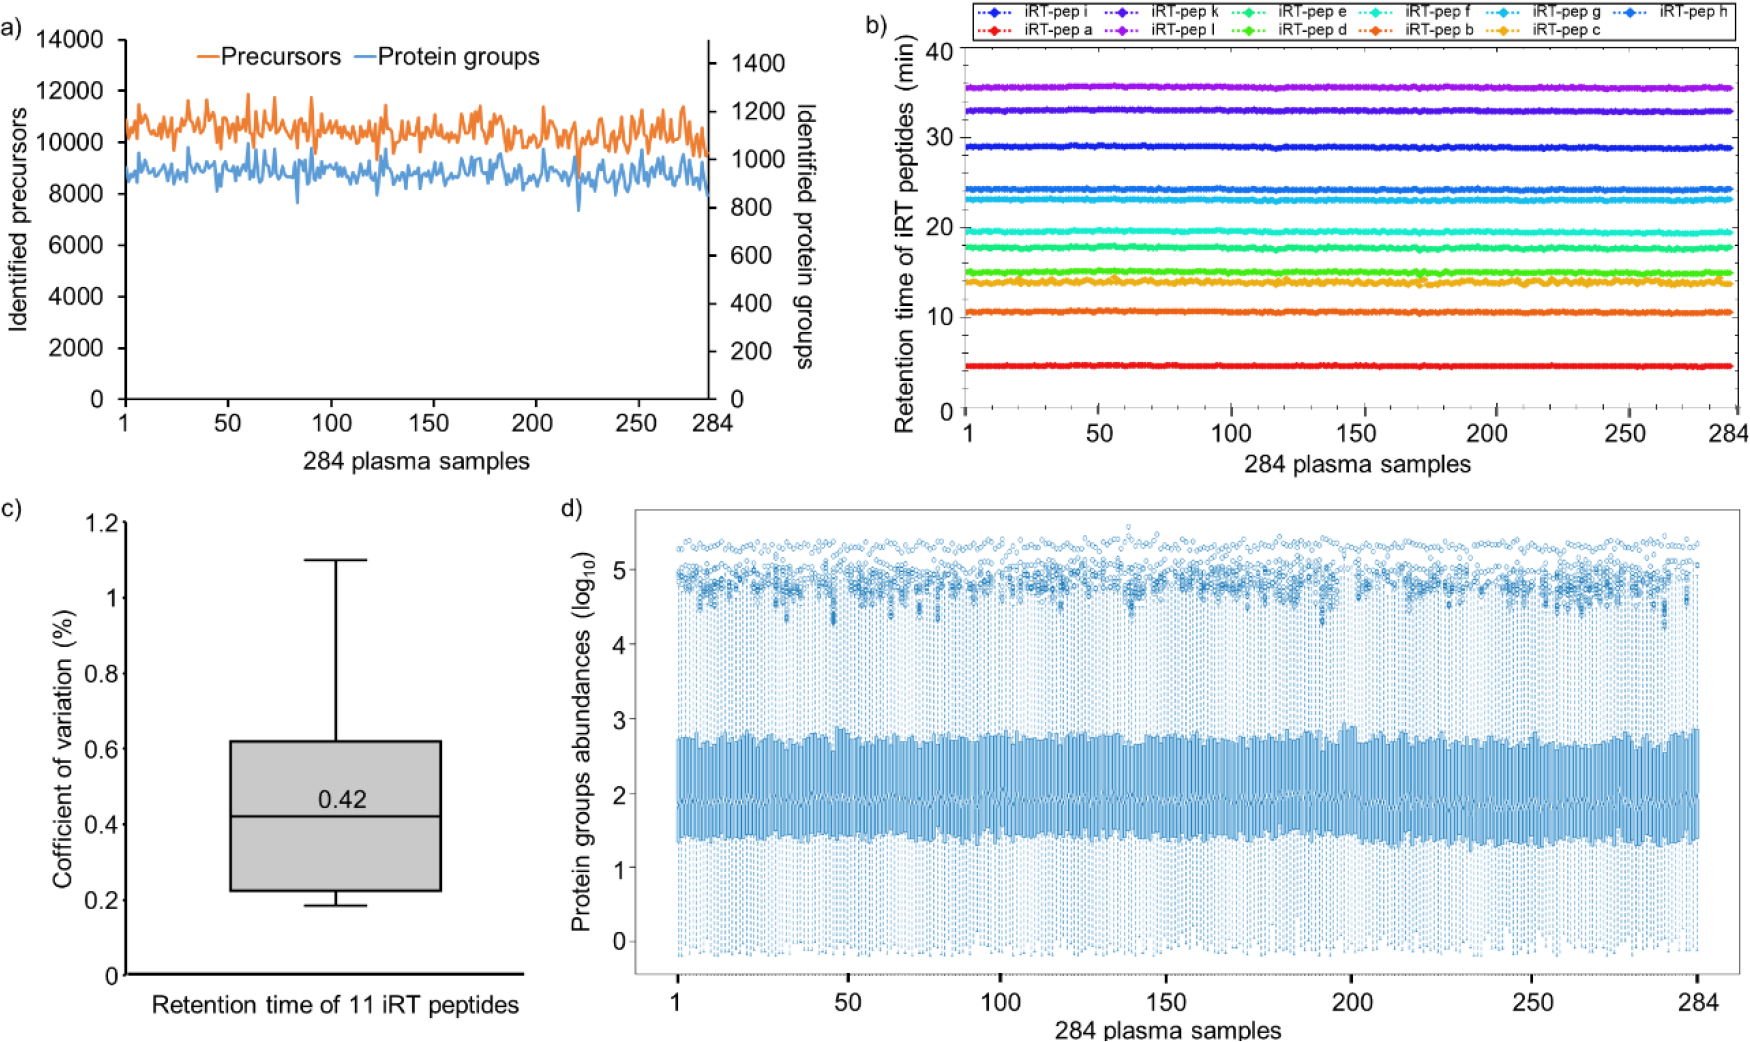
Figure 3.

Large-scale quantitative analysis of undepleted mouse plasma samples using VIP-HESI coupled with microflow LC-MS/MS system. a) Number of precursors (orange) and protein groups (blue) quantified with 284 mouse plasma samples analyzed in a 45 min 40 μL/min microflow gradient on Vanquish Neo HPLC coupled to Bruker timsTOF Pro. b) A retention time QC plot for 11 iRT peptides spiked in each sample. c) Distribution of CV in retention time of iRT peptides across 284 samples, and the median is depicted as a solid line. d) Distribution plot of raw (un-normalized) protein quantities estimated in dia-PASEF analysis for 284 undepleted mouse plasma samples. Log10 protein quantities are plotted on the y-axis, sample number on the x-axis. Overall, protein quantities were similar across all samples with good alignment of sample medians and distributions over the first and third quartiles.
