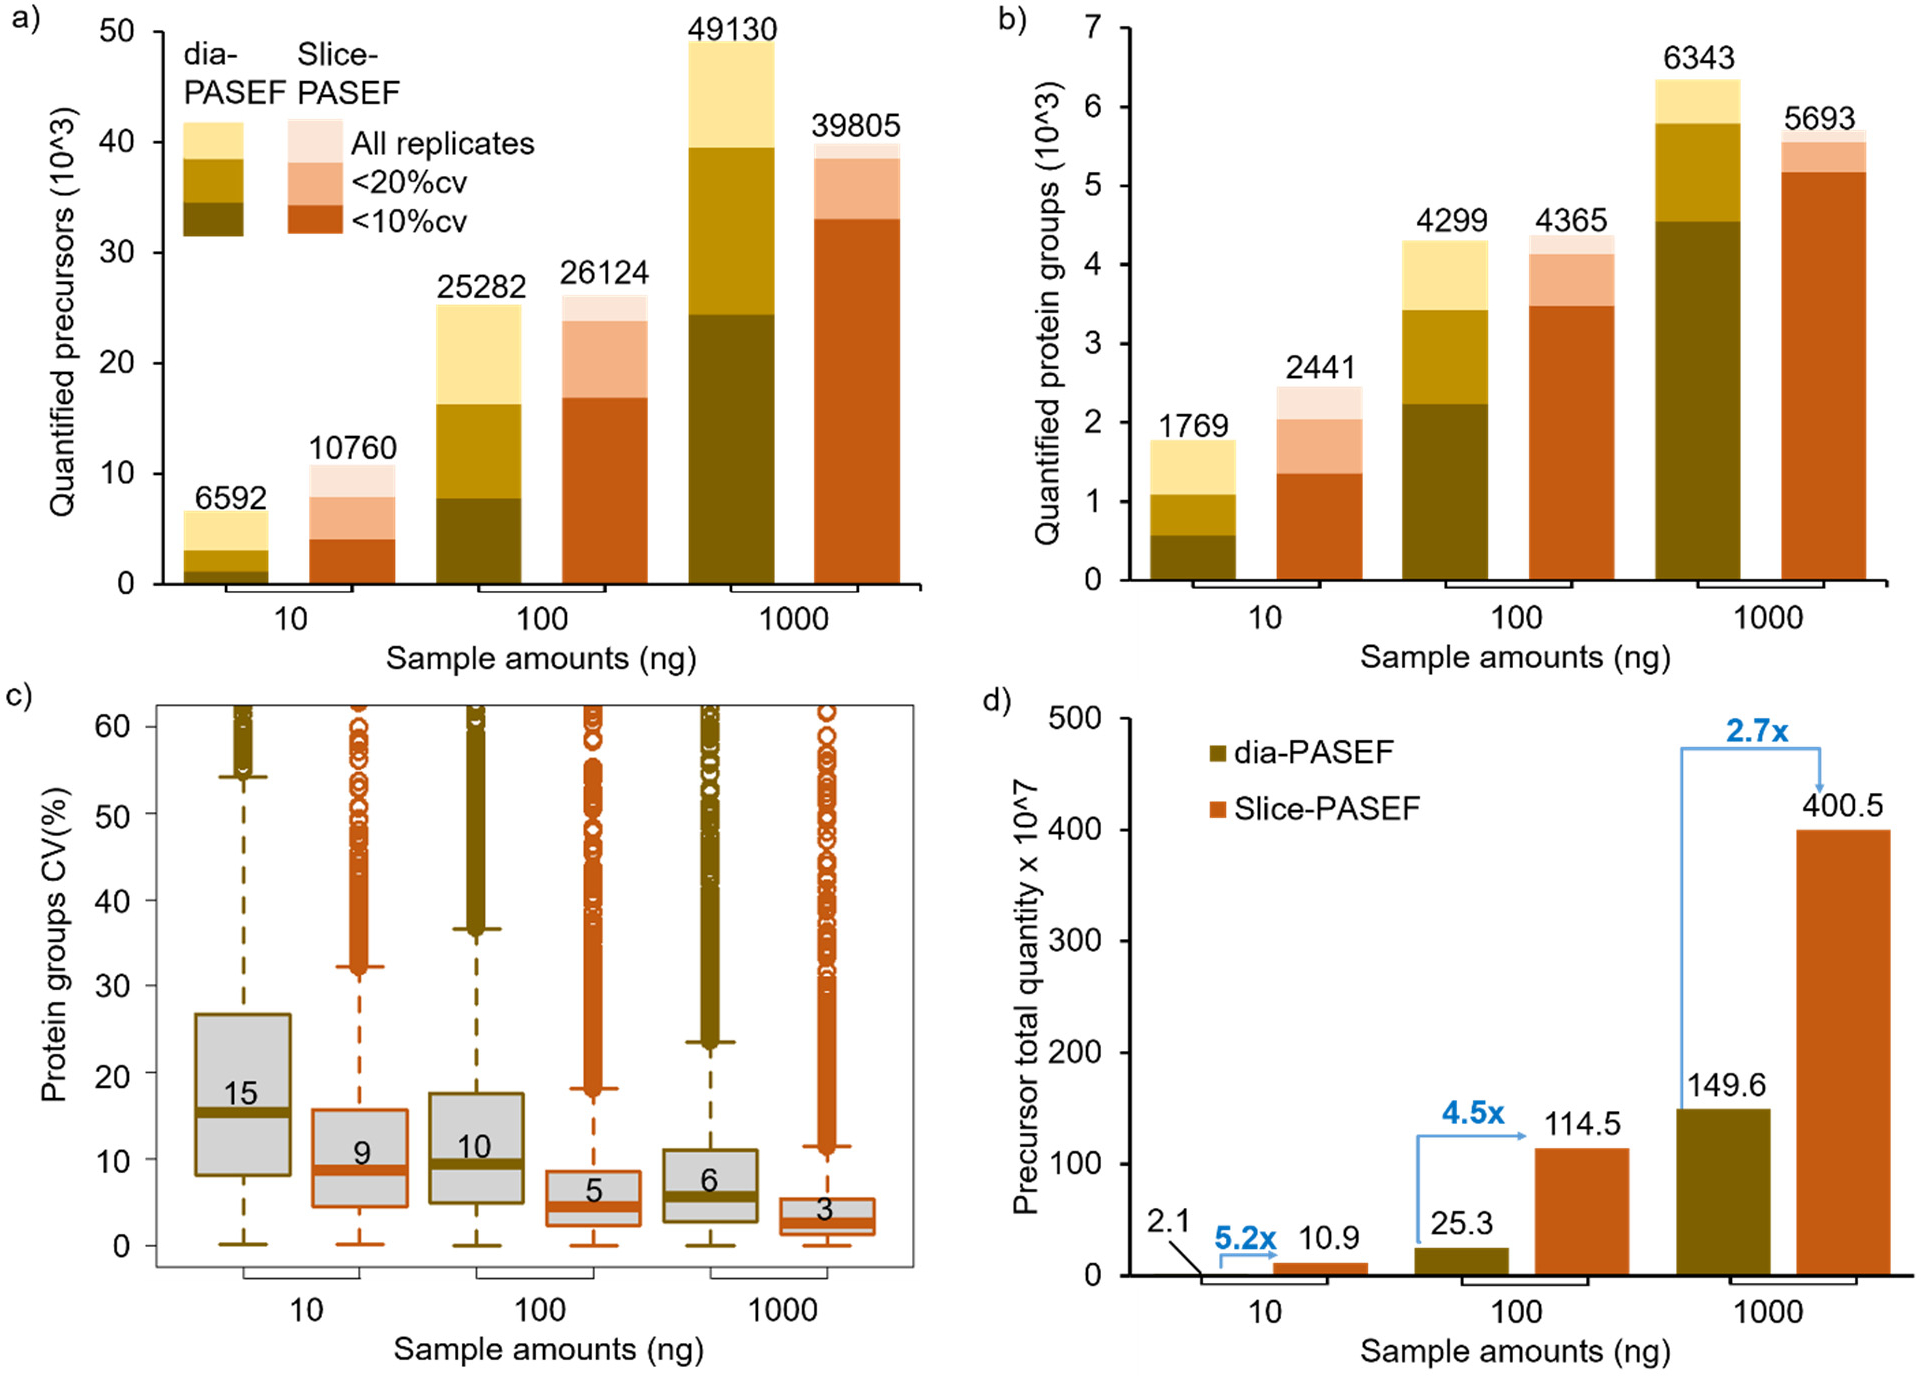
Figure 4.

Performance of VIP-HESI-microflow setup with low sample amounts measured using dia-PASEF and Slice-PASEF acquisition methods. a) The number of precursors and b) protein groups quantified with different injection amounts of a HeLa tryptic digest analyzed in triplicate with a 21 min 20 μL/min microflow gradient on Vanquish Neo HPLC coupled to a Bruker timsTOF Pro. The precursors and protein groups that were observed in all three replicates of each measurement were represented as all replicates, and quantification precisions expressed as CV are illustrated at 10% and 20% levels. The Slice-PASEF method outperformed the dia-PASEF method in a 10 ng sample amount by quantifying more precursors and proteins at both the 10% and 20% CV levels. c) Distribution of the CVs of protein groups identified in all three replicates of different measurements at 1% protein FDR estimated by DIA-NN. The first and third quartiles are marked by a box with a whisker marking a minimum/maximum value ranging to 18 interquartile and the median is depicted as a solid line. d) The total quantity of all precursors identified in each measurement estimated by DIA-NN. The signal boost in the total quantity of all precursors between the same injection amounts is marked by the blue-colored arrows. The maximum boost is observed in the lowest sample amount of 10 ng measurements using the Slice-PASEF method.
