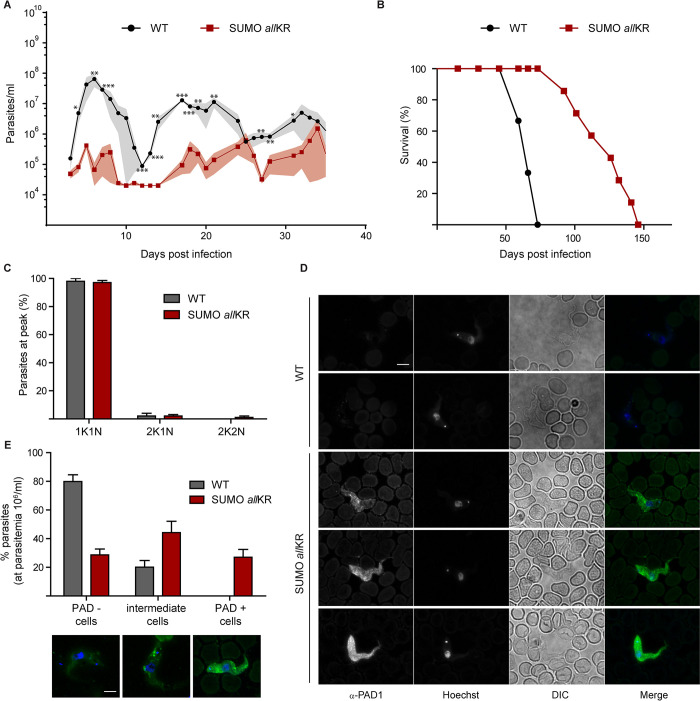
Fig 5. Mice infections with SUMO chain mutant pleomorphic parasites.
BALB/c mice were infected intraperitoneally with 5000 WT or SUMO allKR parasites. (A) Time course of parasitemia in mice infected with WT (n = 3, black circles) or SUMO allKR parasites (n = 7, red squares). Results are shown as the means and their corresponding SEM (gray shaded area). (B) Mice survival was monitored daily and is shown by a Kaplan-Meier curve for infections with WT (n = 3, black circles) and SUMO allKR parasites (n = 7, red squares). (C) Nucleus and kinetoplast configuration was analyzed in methanol-fixed blood smears stained with Hoechst. (D) Representative images of methanol-fixed blood smears of infected mice prepared and stained with anti PAD1 antibodies (green) and Hoechst (blue). (E) Quantification of PAD1 stained parasites of (D). The bottom panel shows representative images of parasites expressing PAD1 in the surface (PAD1 positive), parasites that do not show any labelling (PAD1 negative) and parasites that express low levels of PAD1 mainly in vesicles (intermediate cells). For (C-E) parasites were collected from the first peak of parasitemia (at 6 dpi). Experiments were performed in triplicates (WT, n = 36; SUMO allKR, n = 62). Scale bar 5 μm. Statistical test: two-tailed paired t test (*P < 0.05; **P < 0.01; ***P < 0.001).

