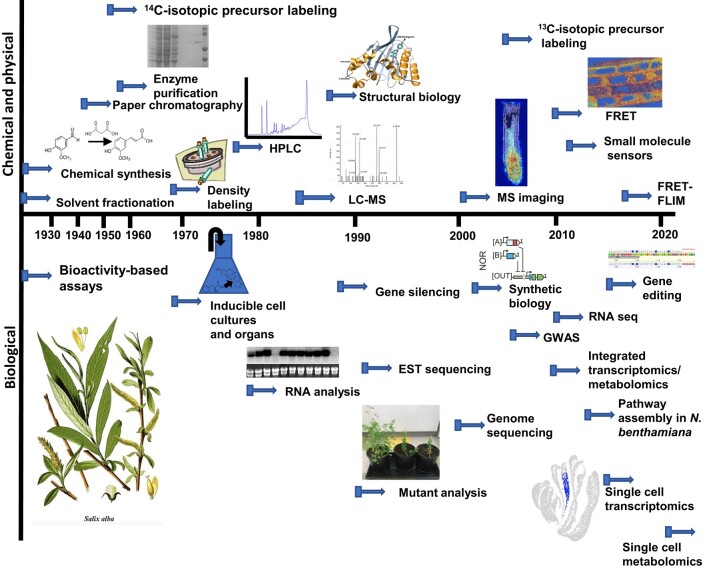
Figure 3.
Timeline for the development of techniques that have driven research on plant secondary metabolites. Pictures are from: MS imaging (Zhang et al. 2023); FRET (Herud-Sikimić et al. 2021); mutant analysis (Adiji et al. 2021); synthetic biology (Brophy et al. 2022); and single-cell transcriptomics (Nolan et al. 2023). The picture bottom left is a vintage lithograph showing the white willow, Salix alba (original book source: Prof. Dr Otto Wilhelm Thomé, Flora von Deutschland, Österreich und der Schweiz 1885, Gera (Germany)—public domain, https://commons.wikimedia.org/w/index.php?curid=2358667). The figure from Brophy et al. (2022) is reprinted with permission from AAAS. Other images are our own or licensed under a Creative Commons Attribution License (CC BY, https://creativecommons.org/licenses/by/4.0/) by Zhang et al. (2023), Herud-Sikimić et al. (2021), and Nolan et al. (2023). EST, expressed sequence tag; FLIM, fluorescence lifetime imaging microscopy.

