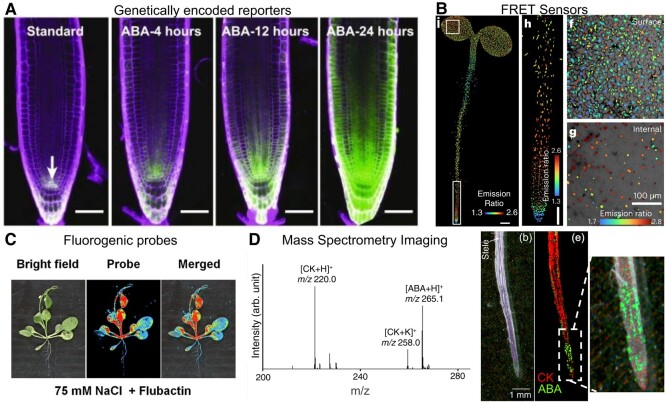
Figure 4.
Examples of techniques used to visualize the localization of secondary metabolites. Each technology shown here is designed to image abscisic acid (ABA). A) A genetically encoded reporter (Wu et al. 2018); B) a FRET sensor (Rowe et al. 2023); C) a fluorogenic, small molecule-based probe (Yang et al. 2022), and this image was reprinted with permission from Yang et al. (2022) copyright 2022 American Chemical Society; and D) an MALDI MS imaging method for imaging phytohormones cytokinin (CK) and ABA (Shiono et al. 2017), and this image was reprinted with permission from Shiono et al. (2017), copyright 2017 American Chemical Society. Images are licensed under a Creative Commons Attribution License (CC BY, https://creativecommons.org/licenses/by/4.0/) by Wu et al. (2018) and Rowe et al. (2023).

