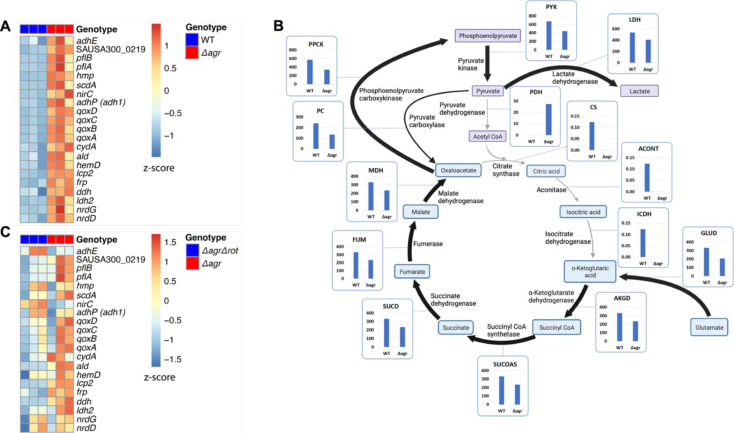
Figure 4. Association of agr deficiency with increased expression of respiration and fermentation genes during aerobic growth.
(A) Relative expression of respiration and fermentation genes. RNA-seq comparison of S. aureus LAC wild-type (WT, BS819) and Δagr mutant (BS1348) grown to late exponential phase (OD600~4.0). Shown are significantly up-regulated genes in the Δagr mutant (normalized expression values are at least twofold higher than in the wild-type). Heatmap colors indicate expression z-scores. RNA-seq data are from three independent cultures. See Supplementary file 1 for supporting information. (B) Schematic representation of agr-induced changes in metabolic flux, inferred from transcriptomic data (Supplementary file 1) by SPOT (Simplified Pearson correlation with Transcriptomic data). Metabolic intermediates and enzymes involved in catalyzing reactions are shown. The magnitude of the flux (units per 100 units of glucose uptake flux) is denoted by arrowhead thickness. Boxed charts indicate relative flux activity levels in wild-type versus Δagr strains. Enzyme names are linked to abbreviations in boxed charts (e.g. lactate dehydrogenase, LDH). See Supplementary file 2 for supporting information. (C) RNA-seq comparison of an Δagr Δrot double mutant (BS1302) with its parental Δagr strain (BS1348). Heatmap colors indicate expression z-scores. Sample preparation and figure labeling as for A. See Supplementary file 3 for supporting information.
© 2024, BioRender Inc
Panel B was created with BioRender.com and is published under a CC BY-NC-ND 4.0. Further reproductions must adhere to the terms of this license


