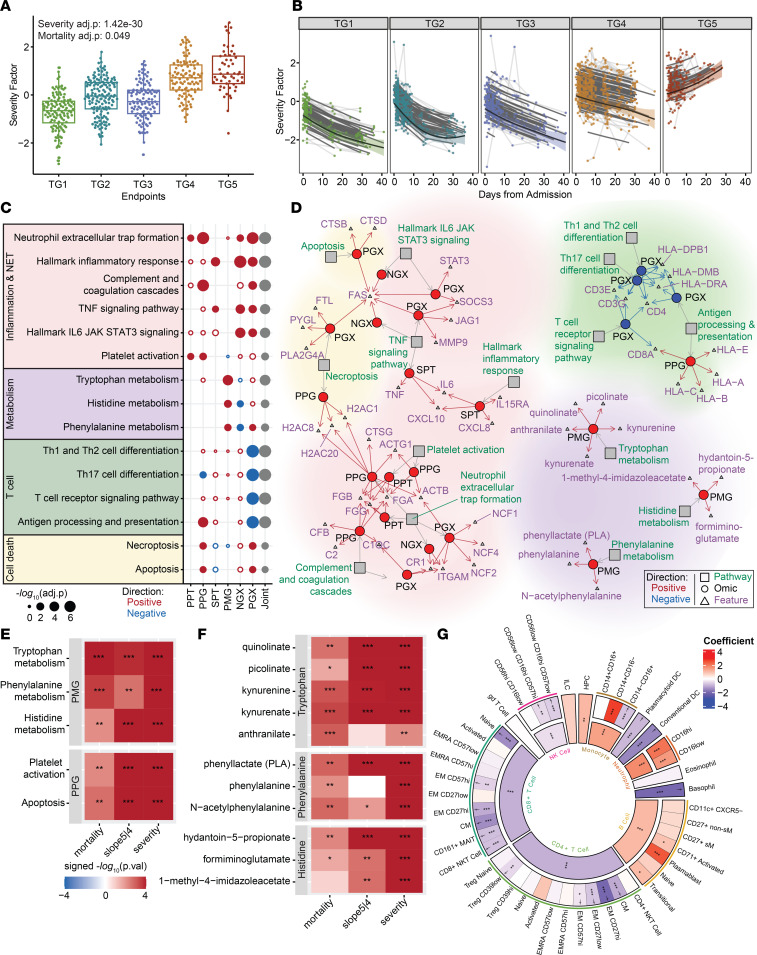
Figure 3. The severity factor increased in severe COVID-19.
(A) The severity factor scores across clinical TGs at baseline (severity adj. P = 1.4 × 10⁻³⁰, mortality adj. P = 0.049). (B) Longitudinal trajectory of the severity factor for different clinical TGs (mortality slope adj. P = 7.1 × 10⁻¹⁵). The shaded region denotes a 95% CI from a generalized additive mixed model of the fitted trajectory (thick black line), thin black lines show individual participant-fitted models, and light gray lines connect the participants’ time points. (C) Pathway enrichment of the severity factor. (D) Network of enriched pathways and selected high-contribution features. The full list of associated features is in Supplemental Table 5. (E) Heatmaps of differential expression tests for pathways in C that showed baseline separation between TG4 and TG5 with linear mixed-effects modeling. (F) Heatmap of differential expression tests of leading-edge metabolites from metabolism pathways in E. (G) Regression coefficients from linear mixed-effects modeling between the severity factor and normalized cell frequencies from whole blood (CyTOF) of both parent and child populations. Daggers indicate a significant association between the reduction of a child cell population frequency, which is significantly associated with the severity factor and severity factor apoptosis signaling in PGX (mortality/severity = baseline mortality/severity task, slope5|4 = TG5 vs. TG4 longitudinally; *P ≤ 0.05,**P ≤ 0.01,***P ≤ 0.001; joint = aggregated P value across omics).

