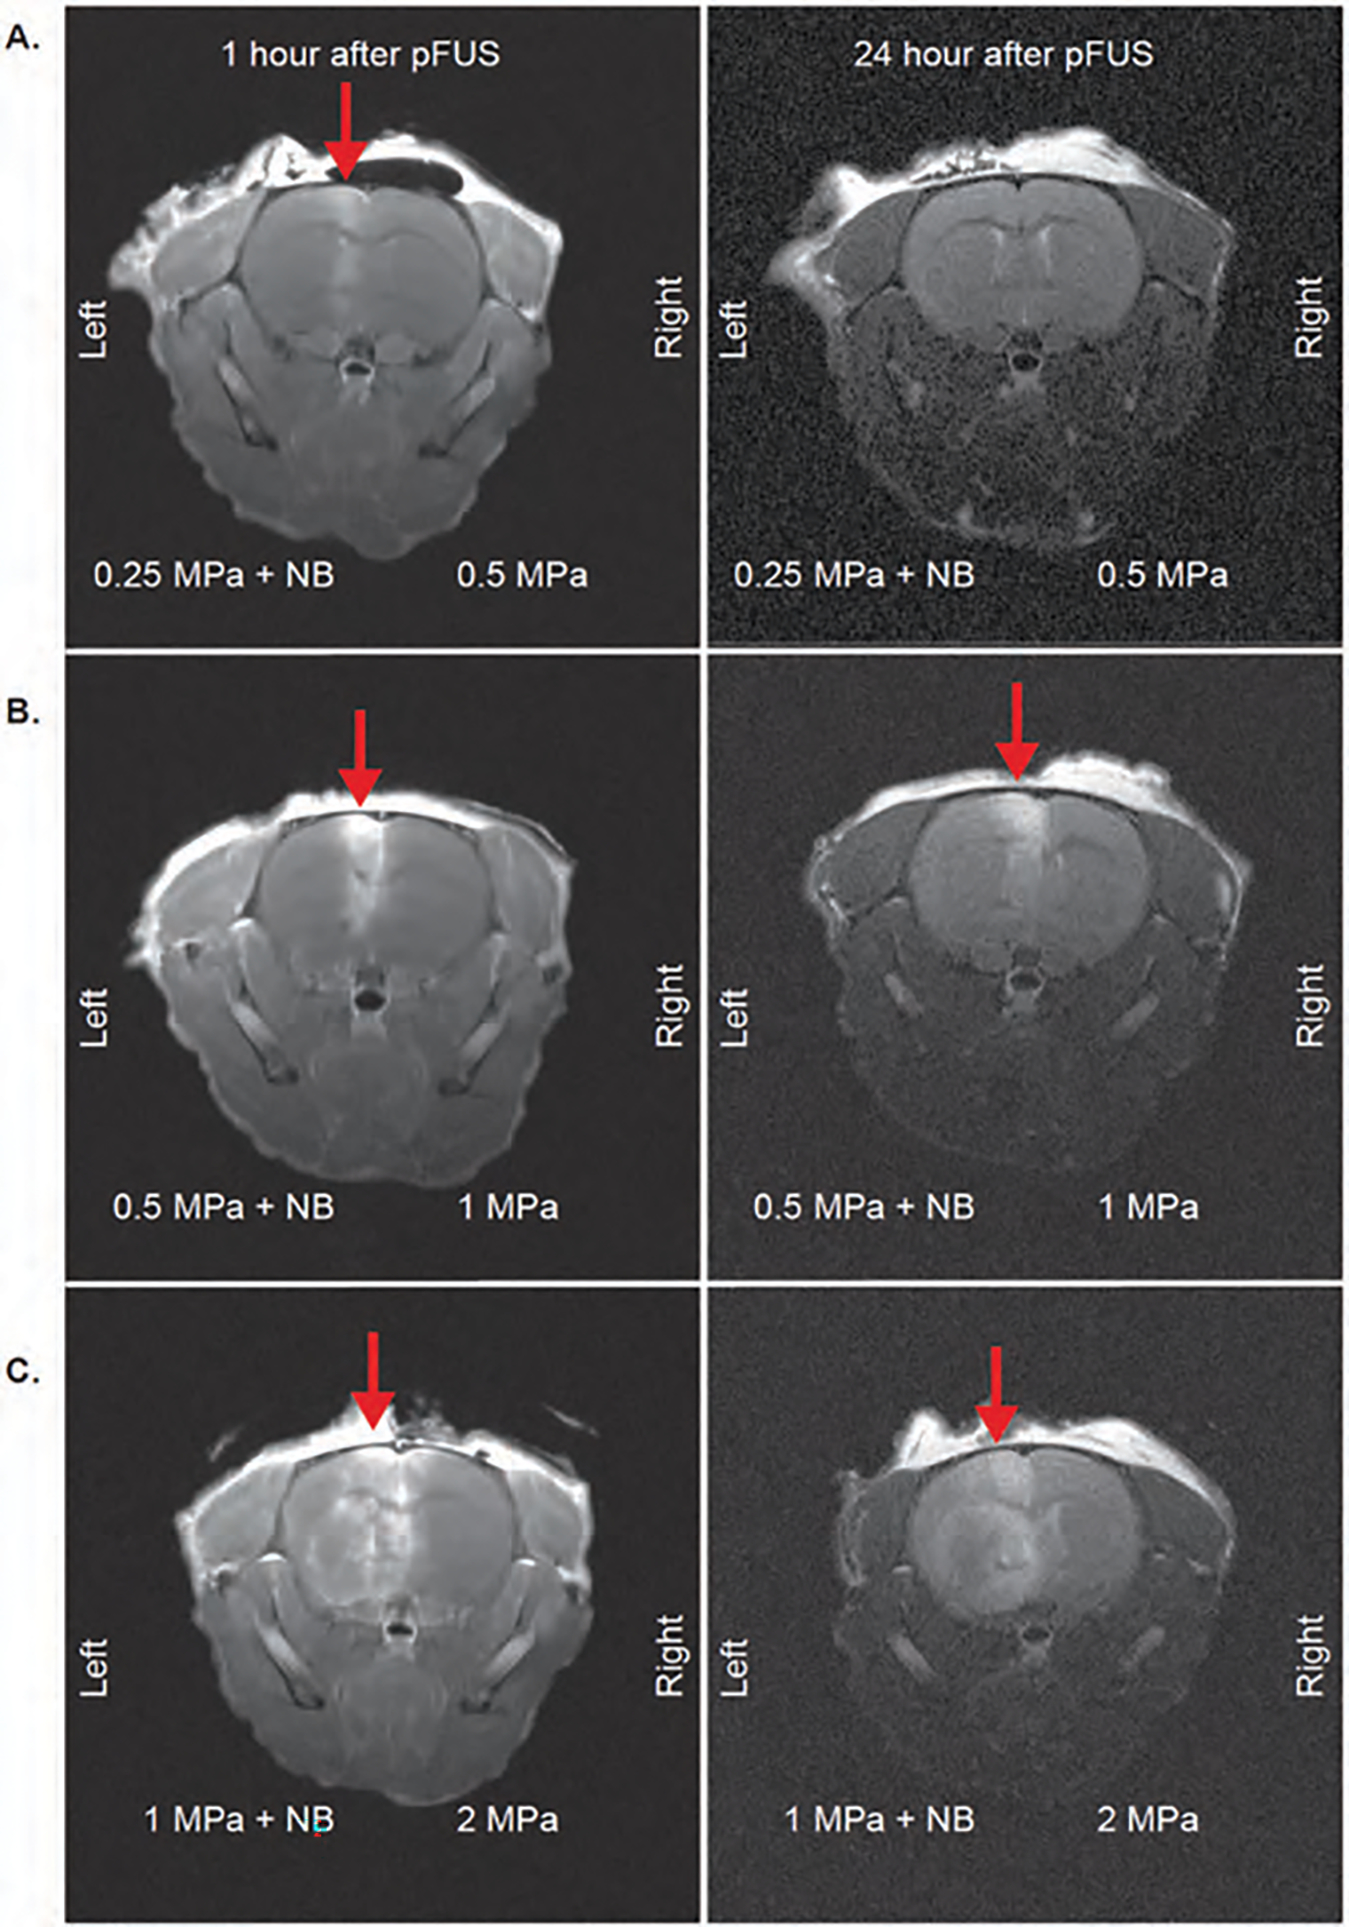
Figure 3.

Post-contrast T1 images to evaluate BBB opening of mice brains with pFUS application. 1 hour and 24 hour MRI images of mice with 0.25 MPa + NB to left hemisphere, 0.5 MPa to right hemisphere (A); 0.5 MPa + NB to left hemisphere, 1 MPa to the right hemisphere (B); 1 MPa + NB to left hemisphere, 2 MPa to the right hemisphere (C). Red arrows indicate leakage from BBB.
