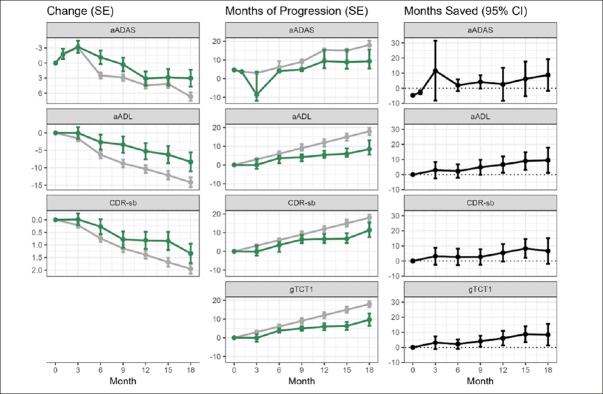
Figure 2.
Trajectories over follow-up time by endpoint in the full patient cohort
2 mg AD04 arm in green, other study arms combined in gray; left panels show patient-level endpoints on original scale; middle panels show endpoints on TCT (or gTCT) scale; right panels show differences between study arms on TCT (or gTCT) scale (gTCT1: aADAS, aADL, and CDR-sb, gTCT2: CDR-sb and Composite, gTCT3: ADAS-Cog, ADCS-ADL, and CDR-sb).

