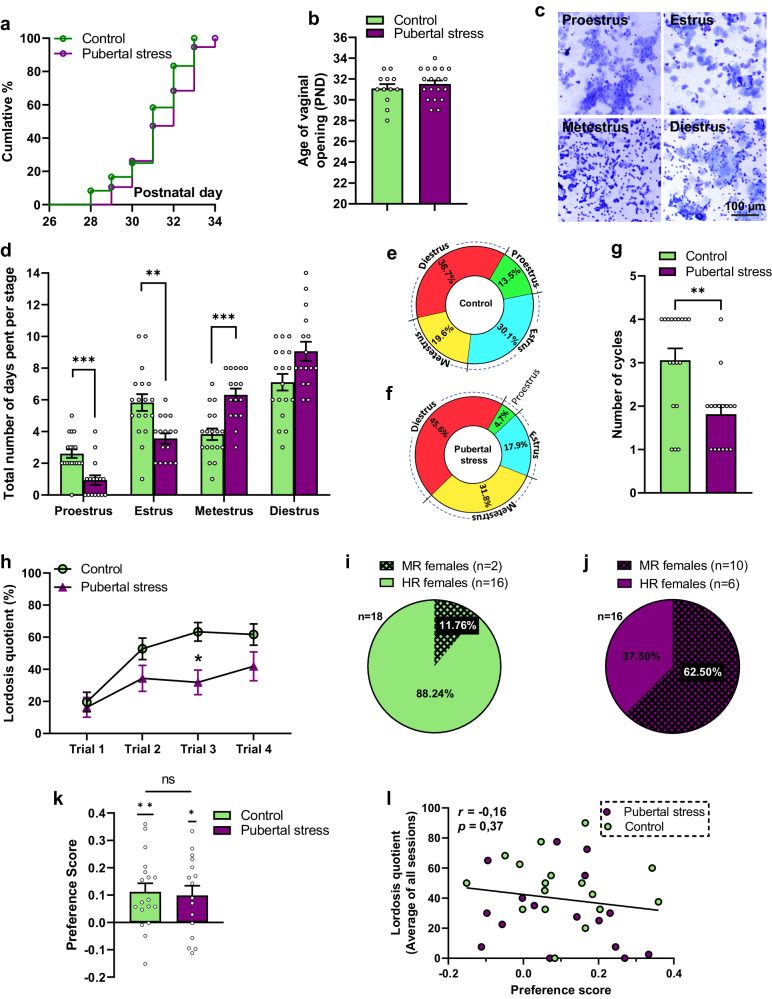
Fig. 1. Female mice exposed to pubertal stress display disrupted estrous cycle and decreased sexual performance.
a Cumulative percentage of females showing vaginal opening. b Age of vaginal opening in pubertally stressed females compared to control subjects. Two-tailed unpaired t test (t(29) = 0.8109, p = 0.424). n = 12 for the control and n = 19 for the pubertal stress group. c Representative images of the different stages of the estrous cycle. d Total number of days spent in each stage of the estrous cycle in females exposed to pubertal stress versus control, non-stressed subjects. Two-way RM ANOVA followed by Bonferroni’s multiple comparison; factor group: F(1,32) = 1.231, p = 0.2755; cycle stage: F(2.304, 73.72) = 55.69, p < 0.0001); group × cycle stage: F(3, 96) = 12.43; p < 0.0001). **p = 0.0041; ***p = 0.0009 for post hoc comparison in proestrus and p = 0.0003 for metestrus. n = 18 for the control, n = 16 for pubertal stress group. e, f Pie charts of the average percentage of time spent in each stage of the estrous cycle in the control and pubertal stress group. g Number of estrous cycles that females went through during the 3-week period of the monitoring of the estrous cycle. Two-tailed Mann–Whitney test: U = 61.50, p = 0.0029. n = 18 for the control, n = 16 for pubertal stress group. h Evolution of lordosis quotient in all trials. Two-way RM ANOVA followed by Bonferroni; factor group: F(1, 32) = 4.950, p = 0.033; session: F(2.539,81.24) = 22.03, p < 0.0001; interaction between the two factors: F(3,96) = 3.152, p = 0.0285). *p = 0.011. n = 18 for the control, n = 16 for pubertal stress group. i Percentage of highly (HR) and minimally (MR) receptive females in the control group. j Percentage of HR versus MR females in the group of female mice exposed to pubertal stress. k Preference score for the control and pubertal stress group. One-sample t test (hypothetical value = 0) (control: t(17) = 3.571, p = 0.0024; Pubertal stress: t(15) = 2.77, p = 0.0143). ns: not significant; unpaired t test (two-tailed) t(32) = 0.2754, p = 0.784. Control (n = 18), pubertal stress (n = 16). l No significant correlation between preference scores and lordosis quotients. Pearson’s correlation r = −0.16, p = 0.3738. All data are presented as mean ± SEM. Corrections were made whenever multiple comparisons test is used. Source data are provided as a Source Data file.

