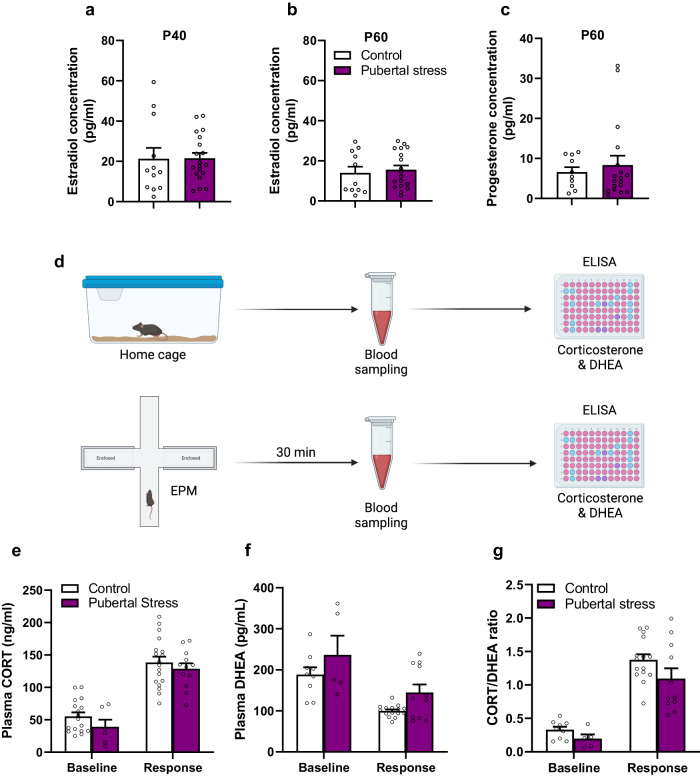
Fig. 2. Effect of pubertal stress on HPG and HPA axis.
a Estradiol concentrations in control and pubertally stressed females at the age of P40. Mann–Whitney test (two-tailed): U = 98, p = 0.535. n = 12 for the control, and n = 19 for the pubertal stress group. b Estradiol concentration at the age of P60. Two-tailed Mann–Whitney test: U = 81, p = 0.4379. Control: n = 11; pubertal stress: n = 18. c Progesterone concentration at the age of P60 in control subjects as well as females that were exposed to pubertal stress. Mann–Whitney test: U = 82, p = 0.724. n = 10 and n = 18 for control and pubertal stress, respectively. d Schematic representation of blood sampling procedures to measure the levels of corticosterone and DHEA by ELISA. EPM: elevated plus maze. Figure created with BioRender.com. e Levels of plasma corticosterone in control and pubertally stressed females under home cage conditions (n = 17 for the control group, and n = 6 for pubertal stress) and following exposure to the elevated plus maze (n = 18 for the control group, and n = 12 for the pubertally stressed females). Two-way RM ANOVA; Group effect: F(1,28) = 2.247, p = 0.145; Treatment effect: F(1,31) = 139.4, p < 0.0001); Group × Treatment effect: F (1,21) = 0.7097). f Concentration of DHEA in plasma at the baseline (home cage; n = 9 for the control group, and n = 5 for the pubertal stress group) versus response (exposure to the EPM; n = 15 and n = 11 for the control and pubertal stress groups, respectively) of the HPA axis. Two-way RM ANOVA; group effect: F(1,36) = 6.062, p = 0.0187; treatment effect: F(1,36) = 22.84, p < 0.0001; Group × treatment effect: F(1,36) = 0.0598. g Corticosterone/DHEA ratio at the baseline (n = 9 and 5 for the control and pubertal stress group, respectively) and following exposure to the elevated plus maze (response: n = 15 and 11 for the control and pubertal stress group, respectively). Two-way RM ANOVA; group effect: F(1, 25) = 1.674, p = 0.207; Treatment effect: F(1, 11) = 88.03, p < 0.0001; group × treatment effect: F(1,11) = 1.134, p = 0.309. Data are presented as mean ± SEM. Source data are provided as a Source Data file.

