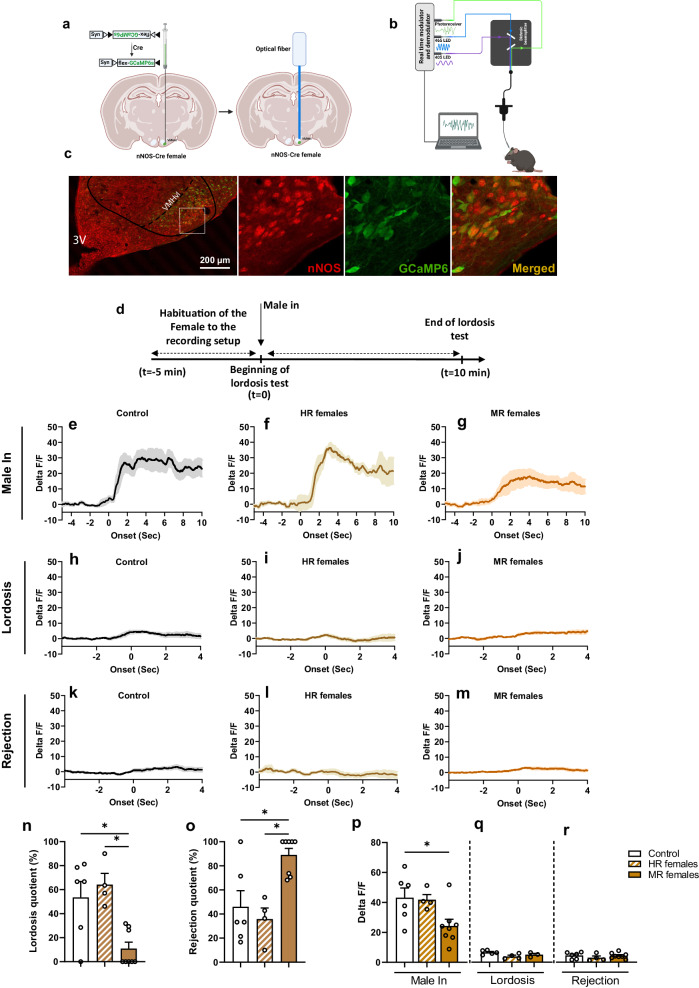
Fig. 5. VMHvl nNOS neurons are particularly activated during interaction with the stimulus male.
a Schematic representation of stereotaxic surgery to inject the AAV virus for expressing the GCaMP6s calcium sensor and fiber optic implantation into the VMHvl. Figure created with BioRender.com. b Schematic representation of the fiber photometry setup used to record the VMHvl nNOS neurons. Figure created with BioRender.com. c Representative images of Cre-dependent GCaMP6s expression in nNOS neurons. d Timeline representation of lordosis behavior test to measure the activity of VMHvl nNOS neurons. All females were submitted to 2 lordosis pre-tests before undergoing the fiber photometry recording during the third session. e–g Peri-event time histograms and (p) peak delta F/F of the nNOS neurons activation when the stimulus male was introduced for lordosis behavior in control group (n = 6), highly receptive (HR) (n = 4) and minimally receptive (MR) (n = 8) females. One-way ANOVA followed by Bonferroni: F(2,15) = 0.0293. *p = 0.0485; Bonferroni’s post hoc test. n Percentage of Lordosis quotient (Kruskal–Wallis test followed by Dunn’s multiple comparison test: H(3) = 8.797, p = 0.0059; *p = 0.0481 and 0.0359 for control vs MR females and HR females vs MR females, respectively), (o) and Percentage of rejection during lordosis test (Kruskal–Wallis test: H(3) = 8.797, p = 0.0059) in control (n = 6), HR (n = 4) and MR females (n = 8) at the day of fiber photometry recording; *p < 0.05; Dunn’s multiple comparisons test. h, i, j, q Activation of the nNOS neurons when females from control group (n = 5), HR females (n = 4) and MR females (n = 3) performed lordosis behavior; only subjects that expressed lordosis were included in the analysis. k, l, m, r Activation of the nNOS neurons when control (n = 6), HR (n = 4) and MR (n = 8) females rejected the mount attempts by the stimulus male. Data are presented as mean ± SEM. Corrections were made whenever multiple comparisons test is used. Source data are provided as a Source Data file.

