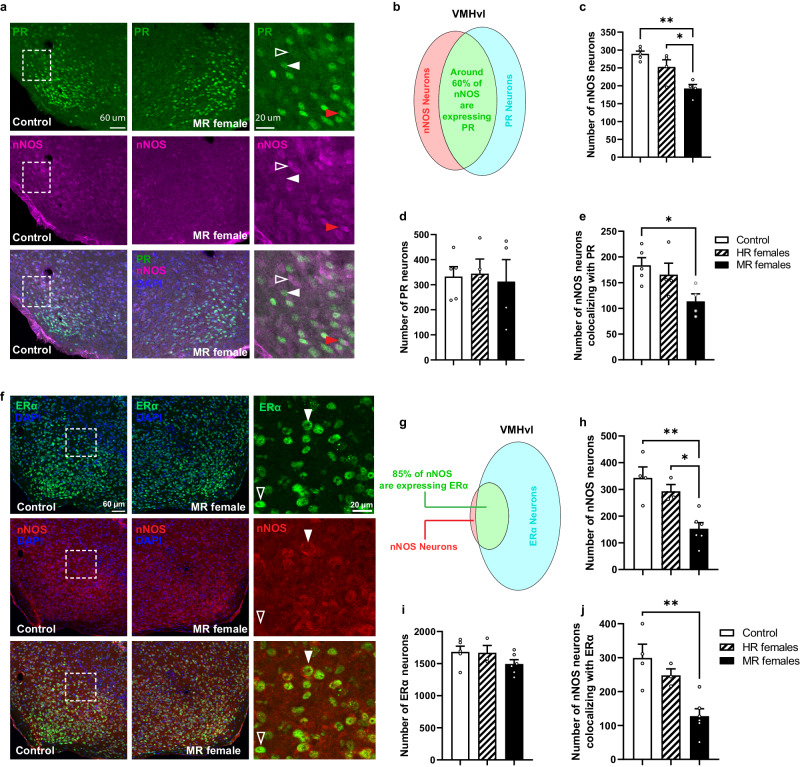
Fig. 8. Pubertal stress reduced the number of nNOS neurons in the VMHvl without affecting progesterone receptor (PR) or estradiol receptor alpha (ERα) populations.
a Representative confocal images showing nNOS and PR coexpression in the VMHvl in control and minimally receptive (MR) females. White dashed box shows the region of high magnification. Red arrow shows an example of a nNOS neuron expressing PR. White arrow indicates an example of a PR neuron that is not coexpressing nNOS, while white hollow arrow points to nNOS expression only. b Venn diagram representing the two populations of nNOS and PR neurons in the VMHvl. c Number of nNOS neurons in the VMHvl. One-way ANOVA; F(2,10) = 131.91, p = 0.0013. *p = 0.0331, **p = 0.011; Bonferroni’s multiple comparisons test. d Number of PR neurons in the VMHvl. One-way ANOVA: F(2,10) = 0.06, p = 0.941. e number of nNOS neurons colocalizing with PR. One-way ANOVA: F(2,10) = 4.329, p = 0.0442. *p = 0.0491; Bonferroni’s multiple comparisons test. n = 5 for control, n = 4 for HR females, and n = 4 for MR females. f Representative confocal images showing nNOS and ERα coexpression in the VMHvl in control and MR females. White dashed box shows the region of high magnification. Solid white arrow shows an example of ERα expressing neuron coexpressing nNOS. White hollow arrow indicates an example of a nNOS neuron that is coexpressing ERα. g Venn diagram representing the distribution of nNOS and ERα and the percentage of their coexpression in the VMHvl. h Number of nNOS neurons in the VMHvl. One-way ANOVA followed by Bonferroni’s post hoc test: F(2,10) = 11.91, p = 0.0023. *p = 0.0331, **p = 0.0028; Bonferroni’s multiple comparisons test. i Number of ERα neurons in the VMHvl; F(2,11) = 1.698, p = 0.227. j Number of nNOS neurons colocalizing with ERα in the VMHvl. F(2,10) = 10.52, p = 0.0035. **p = 0.004; Bonferroni’s post hoc test. Control (n = 4), HR females (n = 3), MR females (n = 6). All data are presented as mean ± SEM. Adjustments were made whenever multiple comparisons test is used. Source data are provided as a Source Data file.

