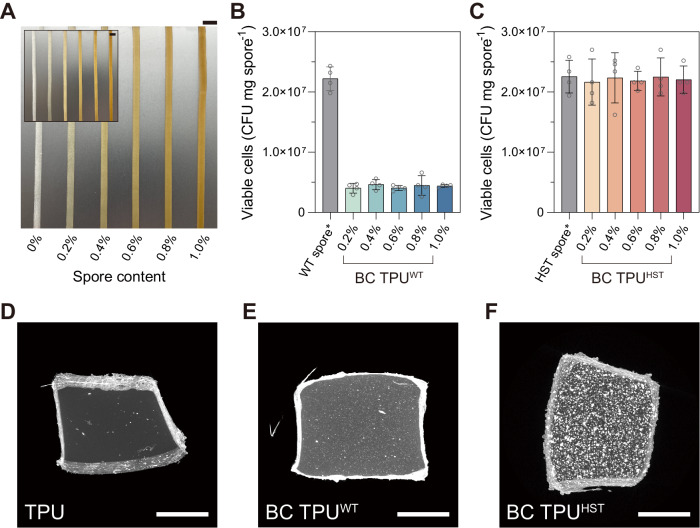
Fig. 3. Fabrication of spore-bearing biocomposite TPU.
A Photographs of BC TPUWT (inset) and BC TPUHST with 0, 0.2, 0.4, 0.6, 0.8, and 1.0 w/w% spore loadings, left to right (scale bars: 10 mm). The viability of WT (B) and HST (C) spores before and after HME. Spores were extracted from BC TPUs by dissolving the TPU component using DMF (no spore loss due to extraction assumed). Asterisk represents that the WT and HST spore controls followed the same solvent treatment procedures with the spores in BC TPUs. Data are presented as mean values ± standard deviations from four independent experiments. D–F MicroCT (XY projection) images of TPU and BC TPUs with 0.8 w/w% WT or HST spores (scale bars: 500 µm). Each XRM image was reconstructed by using 2401 projection images. XRM was presented without replication. Other XRM reconstruction images and movies are presented in Supplementary Fig. 7 and Supplementary Movies 1–3. Source data are provided as a Source Data file.

