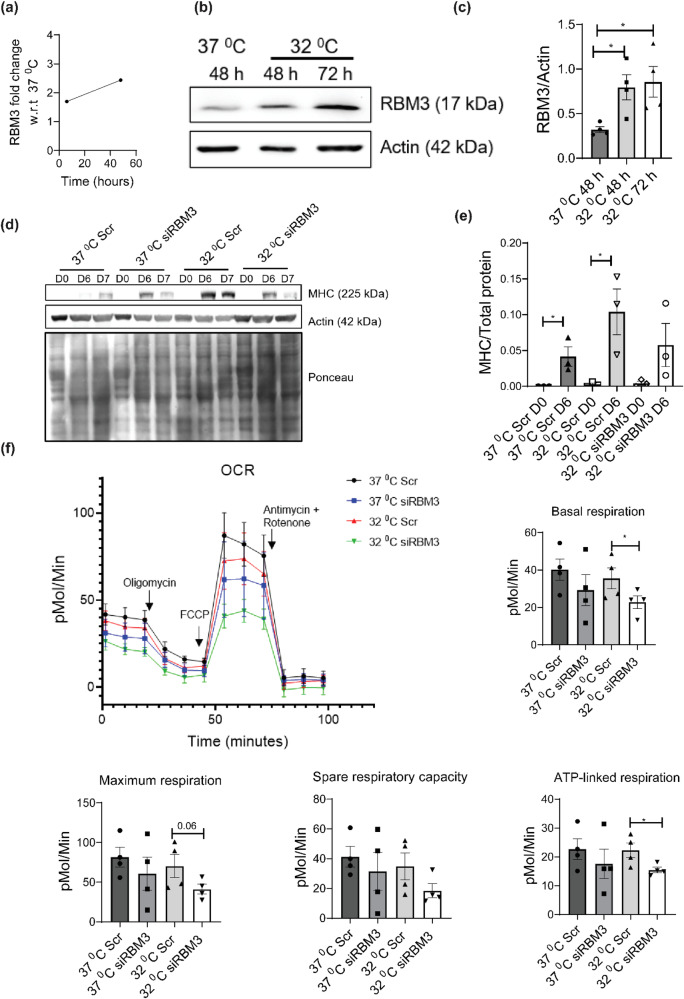
Fig. 4. Hypothermic pre-conditioning of C2C12 myoblasts at 32 °C for 72 h followed by differentiation and respirometric analysis, with or without knockdown of RBM3.
a Line graph showing the fold change of protein levels of RBM3 upon hypothermic treatment at 32 °C with respect to 37 °C at different time points (6 h and 48 h). b Western blot of protein levels of RBM3 using C2C12 cells cultured at 37 °C and 32 °C for 48 h and 72 h respectively. c Bar graph quantifying the western blot image in b, where the y-axis represents the intensity of RBM3 normalized to Actin (n = 4). Significance tested by two-tailed student’s t test (unpaired). d Western blot of protein levels of MHC using C2C12 cells transfected with scrambled (Scr) or siRBM3 and differentiated for 6 days at 37 °C after hypothermic pre-conditioning. e Bar graph quantifying the western blot image in d, where y-axis represents the intensity of MHC normalized to total protein, (n = 3). Significance tested by two-tailed student’s t-test (unpaired). f Line graph showing the mitochondrial oxygen consumption rate (OCR) of C2C12 cells transfected with Scr or siRBM3 and incubated at 37 °C and 32 °C (72 h) respectively. X-axis represents time in minutes and the y-axis represents oxygen consumption rate in pMol/min. Bar graph quantifying the basal respiration, maximum respiration, spare respiratory capacity and ATP-linked respiration of the cells (n = 4). Error bar in the bar graphs represent standard error of mean (SEM). Significance tested by two-tailed student’s t test (unpaired). *, **, *** p < 0.05, 0.01 and 0.001.

