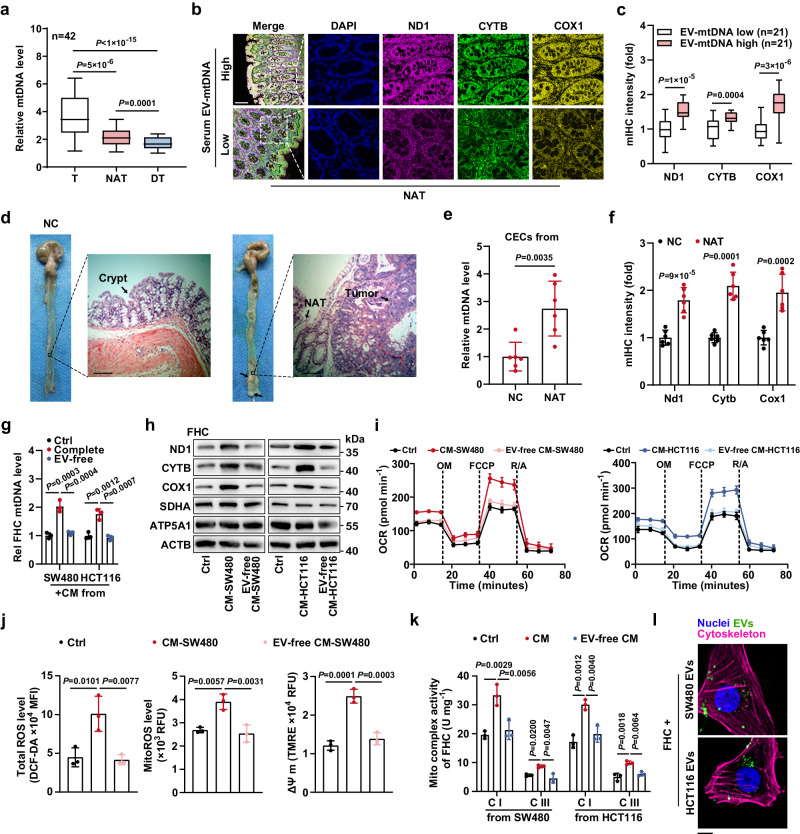
Fig. 2. CECs exhibit enhanced OXPHOS upon communication with CC cells in an EV-dependent manner.
a The mtDNA levels in tumor tissues (T), normal tissues adjacent to the tumor (NAT), and paired distant colonic tissues (DT) from 42 CC patients were measured. The boxplots indicate median (center), 25th and 75th percentiles (bounds of box), and 2.5th and 97.5th percentiles (whiskers). b Representative images of mIHC staining for the indicated proteins in sections from NAT of patients. Scale bar, 100 μm. c The coexpression of mitochondrial proteins was evaluated. The boxplots indicate median (center), 25th and 75th percentiles (bounds of box), and 2.5th and 97.5th percentiles (whiskers). d Representative gross view and HE images of normal colonic crypts and NAT from healthy mice (negative control, NC) and murine orthotopic CC model, respectively. Scale bar, 100 μm. e The mtDNA levels in CECs from NC mice or NAT were measured. n = 6 mice per group. f The coexpression of mitochondrial proteins was evaluated. n = 6 mice per group. Changes in the (g) mtDNA content, (h) expression levels of mitochondrial proteins, and (i) oxygen consumption rate (OCR) in FHC cells incubated with SW480 or HCT116 cell-derived complete CM or EV-removed CM. The samples derive from the same experiment but different gels for SDHA, COX1, and ND1, another for ACTB, ATP5A1, and another for CYTB were processed in parallel. Rel, relative. n = 3 independent experiments. j Changes in ROS levels and mitochondrial membrane potential (ΔΨ m) in FHC cells incubated with SW480 cell-derived complete CM or EV-removed CM. n = 3 independent experiments. k Changes in the activities of mitochondrial complexes I and III in FHC cells incubated with SW480 or HCT116 cell-derived complete CM or EV-free CM. n = 3 independent experiments. l Example images of CC cell-derived EV uptake by FHC cells. Scale bar, 10 μm. Data are means ± SD. Two-tailed t test (c, e, and f). One-way ANOVA with Tukey’s multiple comparisons test (g, j, and k). Friedman test with two-sided Dunn’s multiple comparisons test (a). Source data are provided as a Source Data file.

