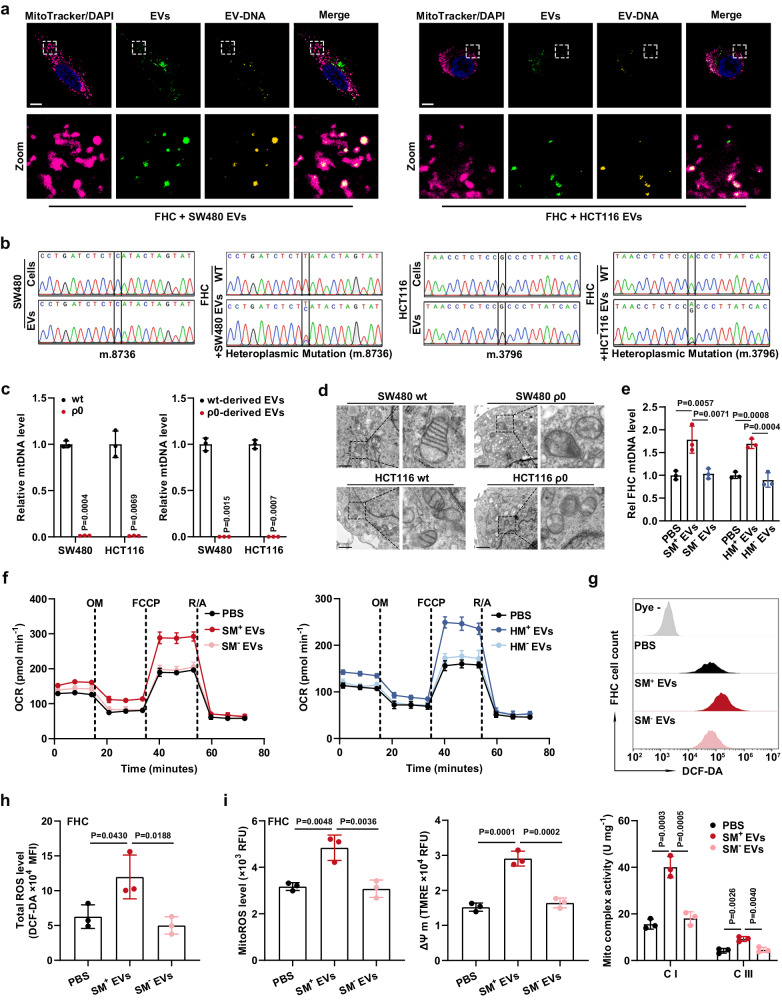
Fig. 4. Transfer of EV-mtDNA leads to enhanced OXPHOS in CECs.
a Confocal images of FHC cells incubated for 24 h with SW480- or HCT116-derived EVs. MitoTracker-labeled mitochondria (magenta), PKH67-labeled EVs (green), EtBr-labeled EV-DNA (yellow), and their co-localization (pale yellow). Scale bar, 10 μm. b Sanger sequencing was performed to detect point mutations in mtDNA purified from CC cells (SW480 and HCT116), their corresponding EVs, and FHC cells with or without tumor cell-derived EV education. c The relative mtDNA levels in SW480, SW480 ρ0, HCT116, and HCT116 ρ0 cells and their corresponding EVs were measured by qPCR. n = 3 biological replicates. d Mitochondrial structure in SW480, HCT116, and their corresponding ρ0 cells was observed using electron microscopy. Scale bar, 1 μm. e, f A subset of FHC cells was educated with mtDNA-sufficient EVs derived from wild-type SW480 cells (SM+ EVs) or HCT116 cells (HM+ EVs), and another subset of FHC cells was educated with mtDNA-depleted EVs derived from SW480 ρ0 cells (SM− EVs) or HCT116 ρ0 cells (HM− EVs). After incubation for 7 days, the (e) mtDNA copy number and (f) oxygen consumption rate (OCR) in these processed FHC cells were determined. Rel, relative. n = 3 independent experiments. g Representative flow cytometric plot and h statistical results of total ROS levels in FHC cells educated with SM+ EVs or SM− EVs for 7 days. n = 3 biological replicates. i Changes in mitochondrial ROS levels, mitochondrial membrane potential (ΔΨ m), and the activities of mitochondrial complexes I and III in FHC cells educated with SM+ EVs or SM− EVs for 7 days. n = 3 independent experiments. Data are means ± SD. Two-tailed t test (c). One-way ANOVA with Tukey’s multiple comparisons test (e, h, and i). Source data are provided as a Source Data file.

