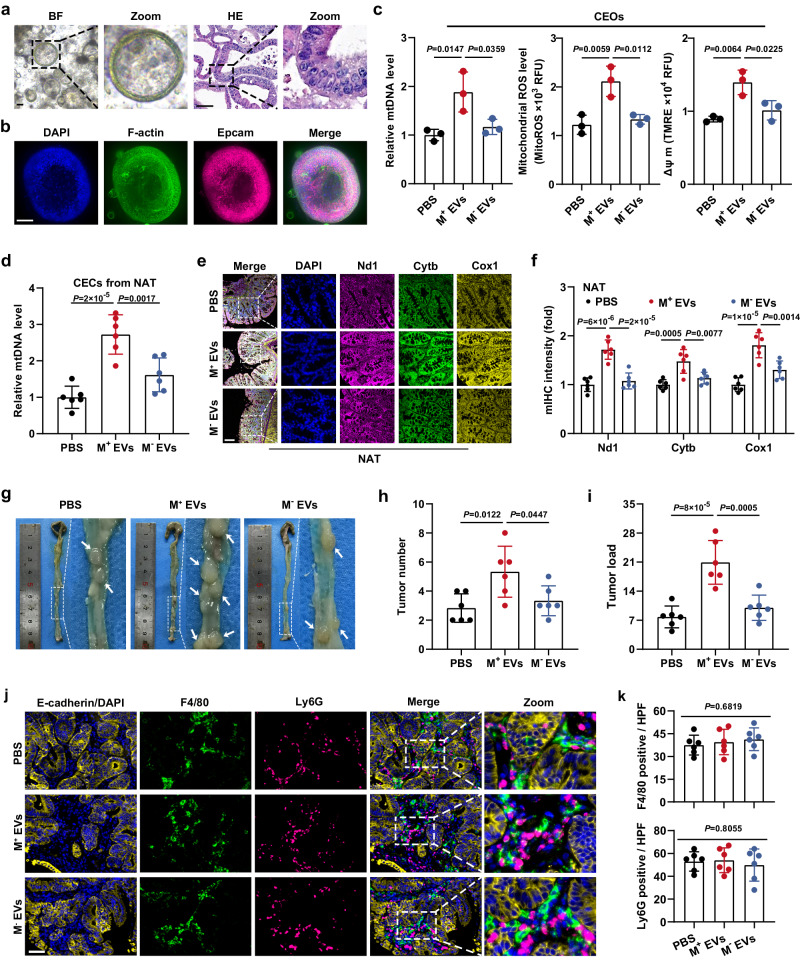
Fig. 5. EV-mtDNA-educated CECs contribute to tumor progression.
Murine colonic epithelial organoids (CEOs) were authenticated using (a) bright-field (BF) pictures, HE staining, and (b) immunofluorescence staining. Scale bar, 50 μm. c Changes in mtDNA content, mitochondrial ROS levels, and mitochondrial membrane potential (ΔΨ m) in CEOs incubated with murine mtDNA-enriched EVs (M+ EVs) or mtDNA-depleted EVs (M− EVs). n = 3 independent experiments. d Determination of mtDNA content in CECs isolated from NAT in the murine orthotopic CC model treated with intraperitoneal injections of EVs derived from wild-type MC38 cells (M+ EVs) or mtDNA-depleted MC38 ρ0 cells (M− EVs). n = 6 mice per group. e Representative images of mIHC staining for DAPI (blue), Nd1 (magenta), Cytb (green), and Cox1 (yellow) in sections from NAT in the murine orthotopic CC model treated with intraperitoneal injections of M+ EVs or M− EVs. Scale bar, 100 μm. f The coexpression of Nd1, Cytb, and Cox1 was evaluated by quantification of the fluorescence intensity in e. n = 6 mice per group. g Representative gross view and statistical results of the (h) tumor number and (i) tumor load in the murine orthotopic CC model treated with intraperitoneal injections of M+ EVs or M− EVs. n = 6 mice per group. j Representative images of mIHC staining for DAPI (blue), epithelial marker (E-cadherin, yellow), macrophage marker (F4/80, green), and neutrophil marker (Ly6G, magenta) in sections from tumors in the murine orthotopic CC model treated with M+ EVs or M− EVs. k Statistical analysis of the number of F4/80-positive or Ly6G-positive cells per high power field (HPF) was then performed. Scale bar, 50 μm. n = 6 mice per group. Data are means ± SD. One-way ANOVA with Tukey’s multiple comparisons test. Source data are provided as a Source Data file.

