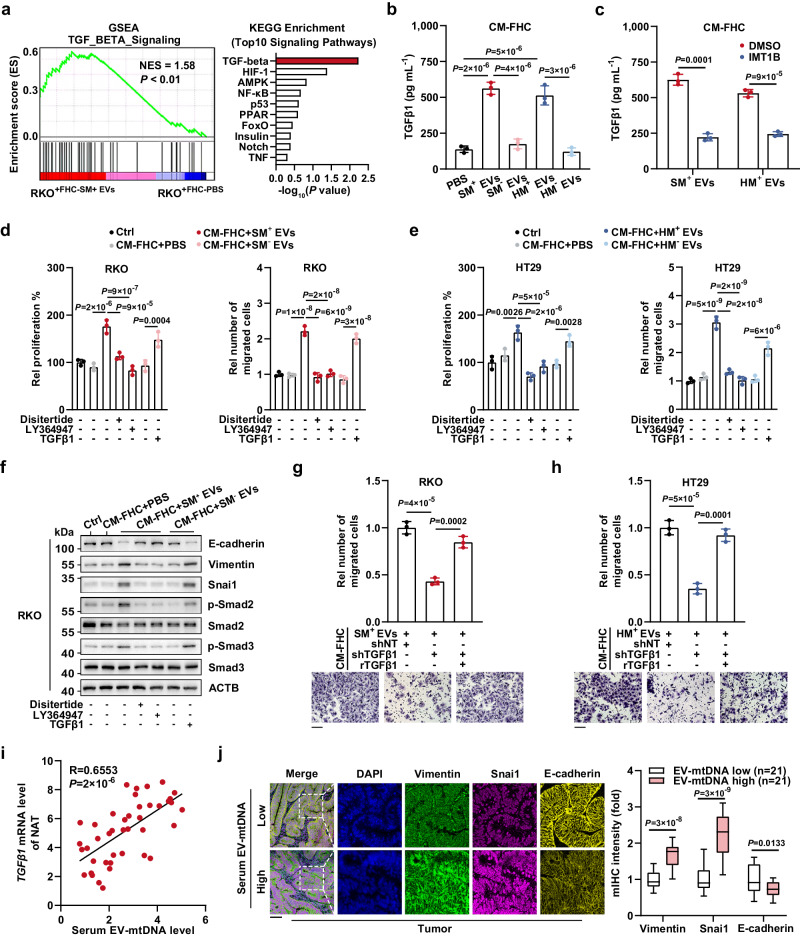
Fig. 6. TGFβ1 upregulation by EV-mtDNA education results in CEC-enhanced tumor malignancy.
a A 0.4-μm Transwell membrane was used to coculture RKO cells with FHC cells prestimulated with SM+ EVs or PBS. Then, the RKO cells were processed for transcriptome sequencing. GSEA using a two-sided permutation test and KEGG pathway enrichment analysis using a two-sided hypergeometric test were performed. b ELISAs were performed to quantify TGFβ1 in CM from FHC. n = 3 independent experiments. c TGFβ1 in CM from EV-educated FHC cells with or without IMT1B treatment (1 μM, 48 h) was quantified. n = 3 independent experiments. d RKO and e HT29 were incubated with CM from FHC cells pretreated with mtDNA-rich or mtDNA-depleted EVs and treated with disitertide (10 μM), LY364947 (1 μM), or TGFβ1 (1 ng mL−1). Then, the proliferation and migration abilities were determined. Rel, relative. n = 3 independent experiments. f The levels of phosphorylated Smad2/3 and EMT markers were examined. The samples derive from the same experiment but different gels for E-cadherin, Vimentin, and Snai1, another for ACTB, p-Smad2, another for Smad2, p-Smad3, and another for Smad3 were processed in parallel. g, h FHC cells expressing shNT or shTGFβ1 were infected with lentivirus expressing rTGFβ1, followed by education with SM+ EVs or HM+ EVs. Then, (g) RKO and (h) HT29 cells were incubated with CM from the processed FHC cells for 48 h. A Transwell migration assay was performed. Rel, relative. Scale bar, 100 μm. n = 3 independent experiments. i The correlation between the serum EV-mtDNA and TGFβ1 mRNA levels in NAT from CC patients (n = 42) was analyzed using two-sided Pearson correlation analysis. j Representative images of mIHC staining in sections of tumor tissues from CC patients. Scale bar, 100 μm. The coexpression of EMT markers was evaluated. Data are means ± SD. The boxplots indicate median (center), 25th and 75th percentiles (bounds of box), and 2.5th and 97.5th percentiles (whiskers). Two-tailed t test (c, j). One-way ANOVA with Tukey’s multiple comparisons test (b, d, e, g, and h). Source data are provided as a Source Data file.

