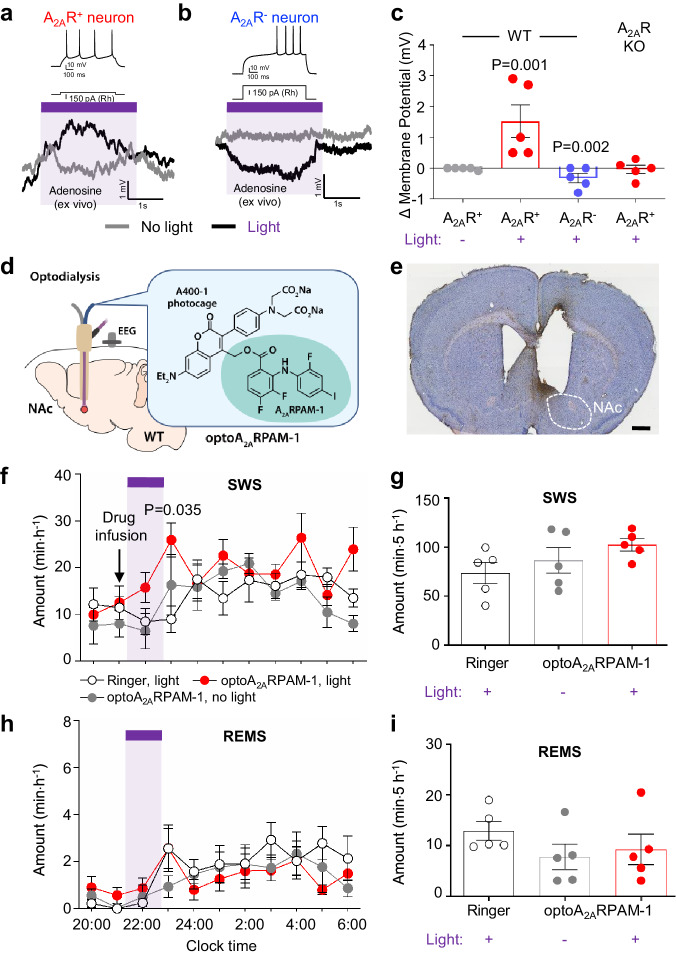
Fig. 4. In-vivo optodialysis of optoA2ARPAM-1 into the NAc.
Resting membrane potential of NAc A2AR+ (a) and A2AR- (b) neurons after treatment with optoA2ARPAM-1 and illumination with violet light (405 nm). The rheobase (Rh) was used to identify A2AR+ (low Rh) or A2AR- (high Rh) neurons (upper traces in a and b). c Changes in the membrane potential of NAc A2AR+ and A2AR- neurons in WT mice and NAc A2AR+ in A2AR KO mice by optoallosteric activation with optoA2ARPAM-1. Data (n = 5 biologically independent animals/group) are presented as mean ± SEM. Unpaired 2-tailed t-test compared with optoA2ARPAM-1 treatment without light. d Schematic of optoA2ARPAM-1 optodialysis into the NAc of WT mice, illustrated by Sara Kobayashi. e Histologic verification of typical cannula placement in the mouse NAc. The experiment was independently repeated 4 times. Scale bar: 1 mm. Time course (f, h) and total amount (g, i) of SWS and REMS after optoA2ARPAM-1 optodialysis into the NAc of WT mice. f, h The purple bar indicates 1-h light illumination. Data (n = 5 biologically independent animals/group) are presented as mean ± SEM. Unpaired 2-tailed t-test compared with the infusion of Ringer’s solution. Source data have been deposited in the Figshare database [10.6084/m9.figshare.25468084]. Abbreviations: A2AR adenosine A2A receptor, EEG electroencephalogram, KO knockout, NAc nucleus accumbens, REMS rapid eye movement sleep, SEM standard error of the mean, SWS slow-wave sleep, WT wild type.

