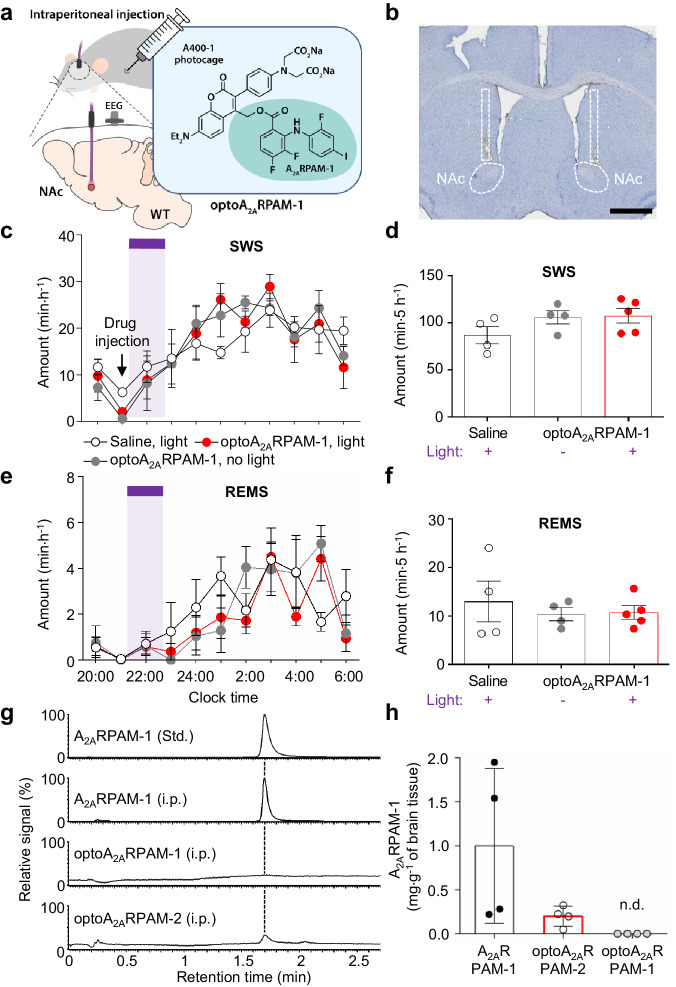
Fig. 5. Systemic administration of optoA2ARPAM-1 together with NAc photoirradiation.
a Schematic diagram of systemic administration (intraperitoneal) of 150 mg kg-1 optoA2ARPAM-1 and NAc photoirradiation with violet light (405 nm) for 1 h, illustrated by Sara Kobayashi. b Histologic verification of typical optic cannula placement in the mouse NAc. The experiment was independently repeated 4 times. Scale bar: 1 mm. Time course (c, e) and total amount (d, f) of SWS and REMS after optoallosteric NAc activation with optoA2ARPAM-1. c, e The purple bar indicates 1-h light illumination. Data [n = 4 (saline), 4 (optoA2ARPAM-1/no light) and n = 5 (optoA2ARPAM-1/light) biologically independent animals in each group] are presented as mean ± SEM. g, h UPLC-MS/MS analysis of brain samples from mice injected intraperitoneally with 75 mg kg−1 A2ARPAM-1, 150 mg kg−1 optoA2ARPAM-1, or 150 mg kg−1 optoA2ARPAM-2. Single ion signal (g) and total brain concentrations (h) of A2ARPAM-1 in the brain samples exposed to violet light. Data (n = 4 biologically independent animals/group) are presented as mean ± SEM. Source data have been deposited in the Figshare database [10.6084/m9.figshare.25468084]. Abbreviations: A2AR adenosine A2A receptor, EEG electroencephalogram, i.p. intraperitoneal, MS/MS tandem mass spectrometry, NAc nucleus accumbens, n.d. not detectable, REMS rapid eye movement sleep, SEM standard error of the mean, Std. standard, SWS slow-wave sleep, UPLC ultra-high-performance liquid chromatography, WT wild type.

