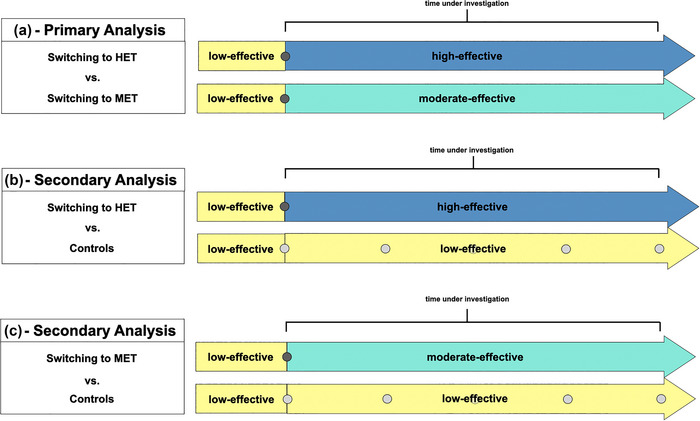
FIGURE 1.

Study design of different analyses. (a) Comparison of patients switching to MET versus patients switching to HET. (b) Comparison of patients escalating to HET versus controls. (c) Patients escalating to MET versus controls. Dark gray dots indicate timepoints of matching. Bright gray dots indicate possible timepoints of matching. HET, high‐efficacy treatment, MET, medium‐efficacy treatment.
