
FIGURE 4.
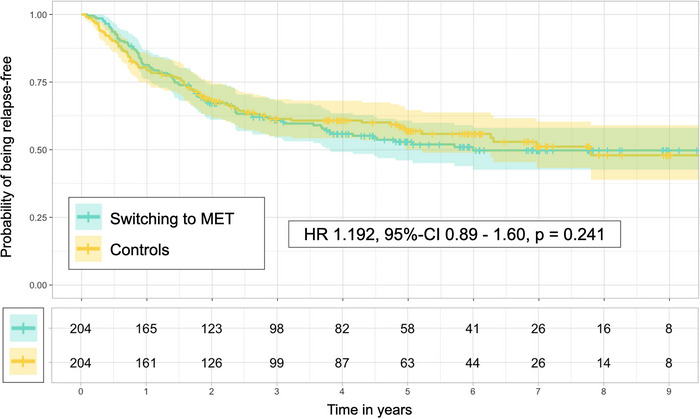
Kaplan–Meier curves (upper panel) and numbers at risk (lower panel) for patients switching to MET (turquoise) and controls (yellow), as well as results from Cox proportional hazard model. HR, hazard ratio; MET, medium‐efficacy treatment; 95% CI, 95% confidence interval.