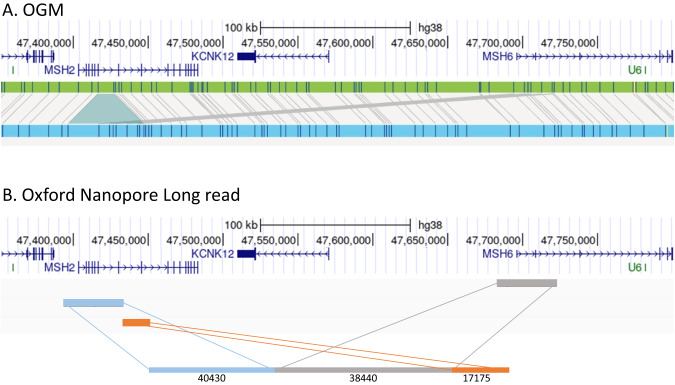
Fig. 2. OGM and long-read sequencing.
A Optical Genome Mapping. Genome-browser view of OGM results, showing ca. 300 kb region encompassing the MSH2 gene from the index patient in family 2. Scale and co-ordinates from GRCh38 (hg38) genome annotation are shown above gene models. The green bar shows the OGM reference genome markers (blue stripes). Light-blue bar shows OGM assembly from patient DNA. Grey bars matching between reference and patient assembly show the insertion of new sequence, and suggest the origin of inserted sequence to be the neighbouring MSH6 gene. B Oxford Nanopore Long read sequencing. Genome browser view of the same 300 kb region, showing alignment of a single long read (length 96,045 bp) spanning the MSH2 locus with inserted MSH6 sequence. The sections of alignment to MSH2 and MSH6 are coloured to aid visualization, with approximate alignment lengths in bp below each section.

