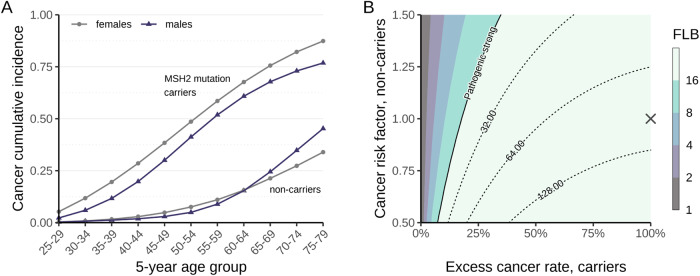
Fig. 4. Co-segregation analysis.
A Cumulative incidence for any cancer by sex, age-group and carriership status. Data for MSH2 mutations carriers from the Prospective Lynch Syndrome Database [14] (smoothed), and data for non-carriers from Cancer Incidence in Five Continents [28], Norway 2008–2012. B Co-segregation sensitivity analysis, showing the contours of the FLB factor as a function of the risk of cancer in non-carriers and the excess rate in carriers. The robustness of the results was evaluated by recomputing the FLB under a range of ever-more conservative penetrance parameters: we varied the cumulative incidences in non-carriers by a factor of 0.50–1.50 and, for each value of this factor, the incidence rates of MSH2 carriers were also varied as a weighted average between the non-carrier incidence rates and their original estimates. These endpoints are represented as 0–100% excess cancer rates, respectively. The cross corresponds to the main co-segregation result reported in the study. The contour curve at FLB = 16 signifies the threshold for pathogenic strong evidence according to Jarvik and Browning [31].

