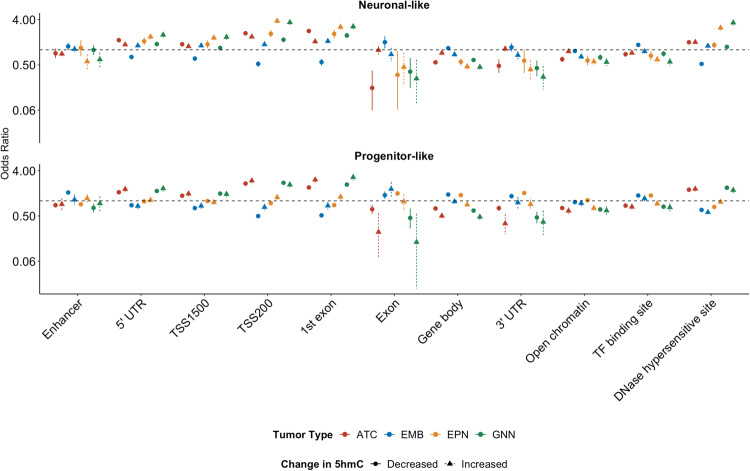
Fig. 5. Cell type-specific differential hydroxymethylation tumor type-specific.
Enrichment of differentially hydroxymethylated CpGs at specific genomic contexts by tumor type and direction of differential methylation as represented by odds ratios and 95% confidence intervals. Odds ratio points and confidence intervals colored by tumor type. The direction of 5hmC change is indicated by the shape indicating the odds ratio. Odds ratios were calculated by Mantel-Haenszel test. Source data are provided as a Source Data file.

