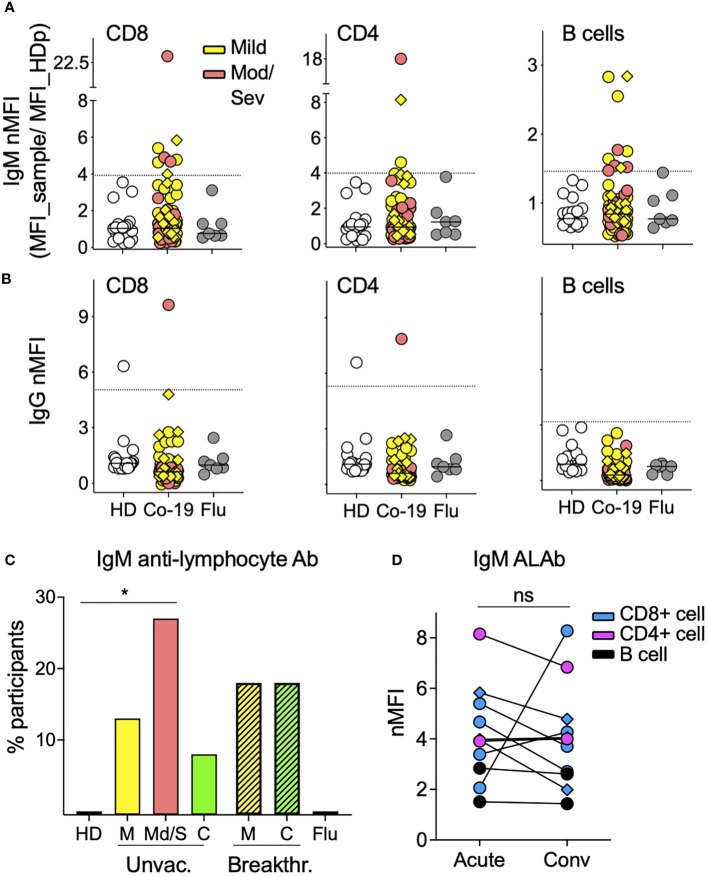
Figure 1.
The prevalence of IgM antilymphocyte antibodies in COVID-19 patients. (A) IgM and (B) IgG anti-lymphocyte antibodies (ALAbs), that bind CD8 (left), CD4 (middle), or B cells (right) were measured in plasma or sera, as described in Materials and methods (see also Supplementary Figure S1 ), from 85 COVID-19 patients (63 mild and 22 moderate/severe, in yellow and orange symbols, respectively), 20 HD in open symbols and seven volunteers infected with flu four days earlier (gray circles). Each symbol represents the normalized Mean Fluorescent Intensity (nMFI) of individual samples, calculated by dividing each sample’s MFI by the MFI of the same HD pool (HDp) run in each experiment. Samples from breakthrough COVID-19 patients are represented by diamonds. HD and Flu nMFIs are the means obtained from two experiments that tested two different HD PBMC as targets. For each lymphocyte population, the discontinuous line represents the HD mean nMFI plus three times their SD, and nMFI equal to or above this threshold was considered positive. (C) Percentage of participants with IgM Ab against at least one of the three lymphocyte populations shown in A in 20 HD, seven Flu patients, 68 unvaccinated COVID-19 patients [46 mild (M), 22 moderate/severe (Mod/Sev) and 20 convalescent (C)], and 17 breakthrough COVID-19 patients (all mild and convalescent pairs). *p = 0.0216 by two-sided Fisher’s exact test. (D) IgM nMFI in plasma or sera from COVID-19 acute and convalescent longitudinal samples. Only patients with both time points available and with IgM ALAb against either CD8 T cells (blue), CD4 T cells (pink), or B cells (black) in at least one of the two time points are displayed. Ns, no significant difference by two-tailed Wilcoxon test.

