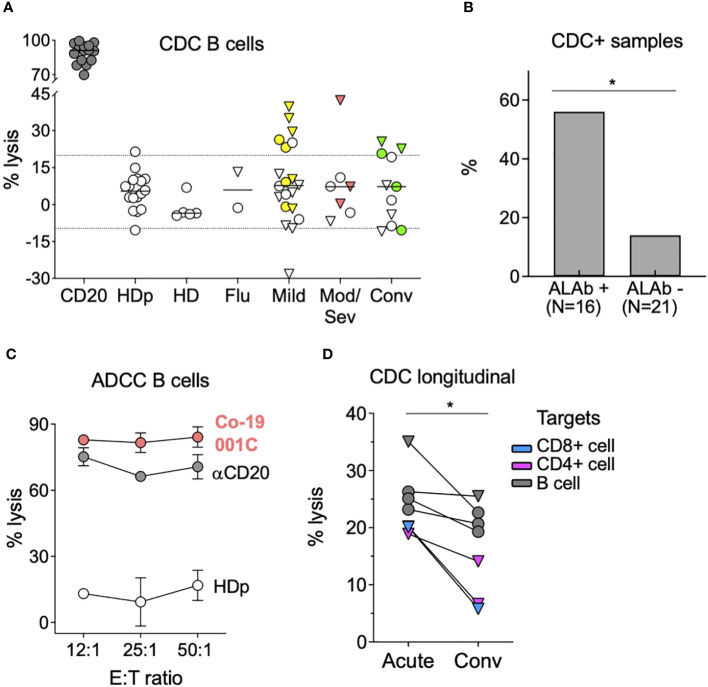
Figure 2.
Anti-lymphocyte antibodies in patients with COVID-19 exert cytotoxicity. (A) Complement-dependent cytotoxicity (CDC) tested in plasma or sera samples included in Figure 1 , comprising 38 COVID-19 participants (20 mild, seven moderate/severe, and 11 convalescents), five HD, and two flu patients. CDC was tested, as described in the Materials and methods, with B cells as targets and anti-CD20 Ab as a positive control. A total of 17 independent experiments were performed, each testing the same HDp sample. Values from individual experiments are represented by circles, and triangles represent the median values from two to four replicate experiments. Yellow, salmon, and green symbols represent mild, mod/sev, and convalescent IgM ALAb positive samples, respectively. Discontinuous lines represent the mean ± 2SD of the HDp samples. See also Supplementary Figure S4A . (B) Plasma samples from COVID-19 participants tested for CDC in A were divided based on the presence or absence of ALAb, with 16 and 21 samples respectively, and the percentage of samples with CDC activity against either lymphocyte (CD4, CD8, or B cells) in each group was calculated. *p = 0.0124 by two-sided Fisher’s exact test. (C) Antibody-dependent cellular cytotoxicity (ADCC) against B cells triggered by plasma from moderate/severe patient (Co-19 001C, in salmon) with high levels of IgG ALAb, as shown in Figure 1B . White and gray circles represent HDp and anti-CD20 antibodies diluted in HDp, respectively. Three different NK effectors-to-target (E:T) ratios were tested. Circles represent the mean, and bars represent the SD of duplicates. A representative experiment out of five is shown. See also Supplementary Figure S4C . (D) The percentage of CDC lysis triggered by plasma from COVID-19 acute and convalescent longitudinal samples. Only patients with both time points available and with CDC activity against either CD8 T cells (blue), CD4 T cells (pink), or B cells (black) at least in one of the two time points are shown. Values from individual experiments are represented by circles, and triangles represent the median values from two to four replicate experiments. *p<0.05, two-tailed Wilcoxon test.

