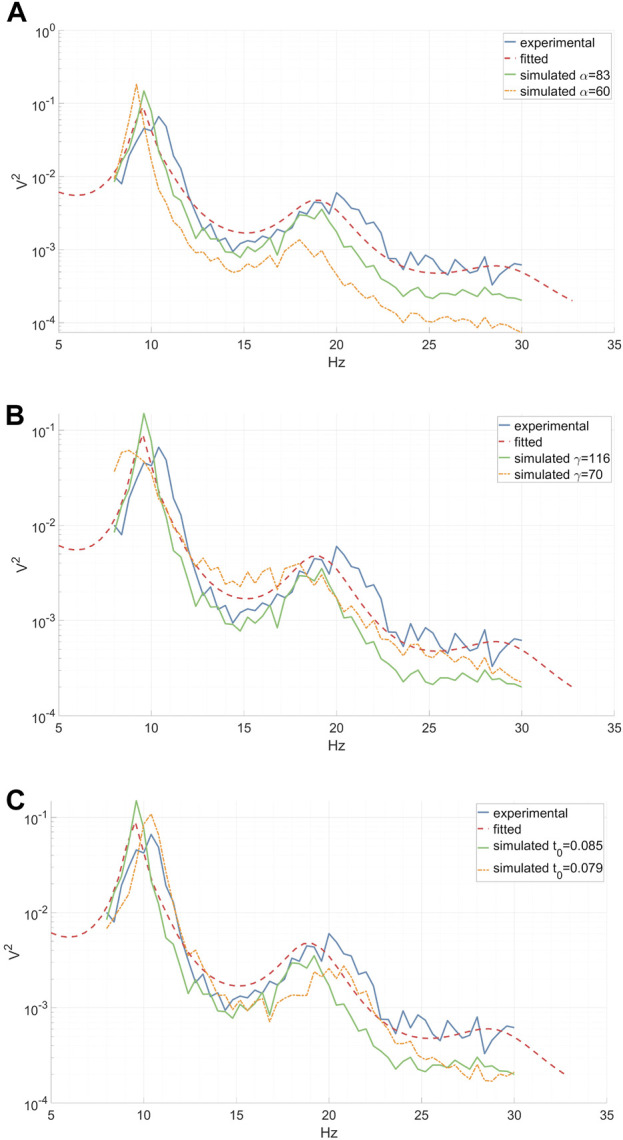
FIGURE 3.

Experimental (inter-epoch average), fitted and simulated power spectra of a right-hand MI CSP source signal between 8 and 30 Hz. Simulated spectra are presented for two distinct parameter values. (A) A reduction in the synaptic decay-time constant α diminishes the total spectral power, especially affecting the high frequencies. (B) A decrease in the cortical damping γ results in a decline in the EEG resonant frequency alpha and its peak shift towards the lower frequencies, along with a slight flattening of the beta peak. (C) A decrease in the corticothalamic propagation delay t 0 leads to a shift of the EEG resonant frequencies alpha and beta peaks towards higher frequencies. (A–C).
