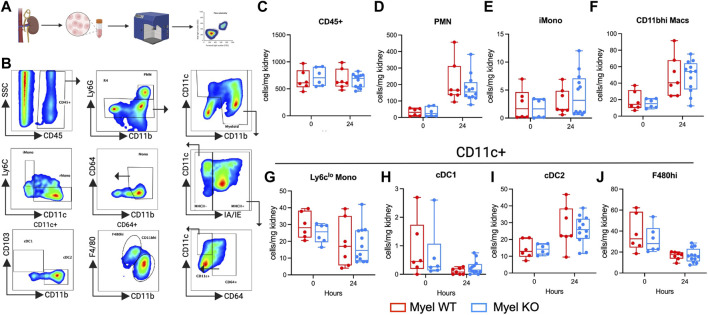
FIGURE 3.
Myel KO mice show similar numbers of leukocyte cell populations compared to Myel WT mice in the kidney at 24-h after I/R. Mice were subjected to sham or I/R, and kidneys were harvested at 24 h. (A) Experimental workflow for testing leukocytes accumulations by flow cytometry in kidneys of Myel WT and Myel KO mice (Created with Biorender.com). (B) Gating strategy for cell populations. Pseudocolor dot plots for (C) CD45+, (D) neutrophils (PMN), (E) Ly6chi Monocytes (iMono), (F) CD11bhi macrophages (CD11bhi Macs). CD11c+ populations include (G) Ly6clo Monocytes, (H) conventional dendritic cell (cDC)1, (I) cDC2, (J) F480hi macrophages. Dots represent individual samples from each group. There were no statistically significant differences between genotypes for any cell population as determined by two-way ANOVA with Sidak test.

